GCSE Tutoring Programme
Our chosen students improved 1.19 of a grade on average - 0.45 more than those who didn't have the tutoring.
In order to access this I need to be confident with:
Calculator skills Fraction of an amount Percentage of an amountThis topic is relevant for:

Stratified Sampling
Here we will learn about stratified sampling, including what stratified sampling is, how to take a stratified sample, and the advantages and disadvantages of stratified sampling.
You can also download the following free stratified sampling resources all suitable for those following Edexcel, AQA or OCR exam boards:
What is stratified sampling?
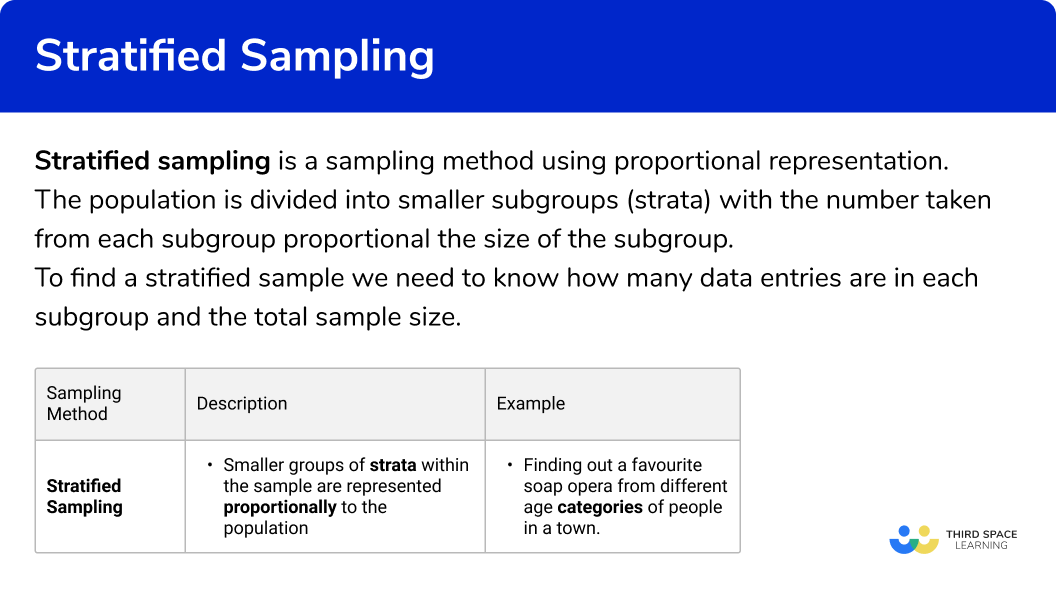
Stratified sampling is a sampling method using proportional representation.
The population is divided into smaller subgroups (strata) with the number taken from each subgroup proportional the size of the subgroup.
The term stratification means to arrange something into groups.
The larger the group, the more data entries will exist in the sample for that group.
To find a stratified sample we need to know how many data entries are in each subgroup and the total sample size.
| Sampling method | Description | Example |
|---|---|---|
| Stratified sampling | Smaller groups or strata within the sample are represented proportionally to the population | Finding out a favourite soap opera from different age categories of people in a town |
Stratified sampling determines the number of items of data in each subgroup and so it requires a secondary sampling method to select the individual items of data.
This is usually through using a simple random sampling technique (using a random number generator). This is why a stratified sample can also be called a stratified random sample.
Note: Stratified sampling no longer features in GCSE Maths exams by name, but it the concept may feature as part of a ratio, fraction or percentage question. Stratified sampling is an important part of GCSE Statistics and A level Maths.
Advantages and disadvantages of stratified sampling
Following a stratified sampling methodology has advantages and disadvantages:
| Advantages | Disadvantages |
|---|---|
| Proportional representation of the population means results can be generalised. It is more time efficient than asking the whole population. Minorities given fair representation. | Requires another sampling method to select individual items of data from a list (random / systematic etc) |
Stratified sampling is used more frequently than other sampling techniques including cluster sampling and systematic sampling (on its own) because the dataset of the sample is proportional to the population size.
This stratifying allocation means that minority groups can be represented whereas they may not be with other probability sampling methods.
Sampling error
If every member of the population is in the sample, there is no sampling error. As the sample gets smaller, or the methodology has introduced a selection bias, the sampling error becomes more significant as this means that the sample may not be representative of the population.
The more random a sample is, the smaller the sampling error.
What next?
Once a stratified random sample is chosen, the next step is data collection where respondents offer data to fulfill the requirements of the questionnaire or survey (for example). The collected values within the sample then go through data analysis to find generalised results for the overall population.
E.g.
You may want to calculate the average reading age of books in a library. Rather than picking up 100 random books from any shelf (this would be random sampling), you find out how the books are categorised i.e. fiction, non-fiction, autobiography, childrens, reference, etc.
Then to get a representative sample you would calculate the number of books from each sub-category that will be needed for the sample, and then use a random sample or systematic sample to select the books from each subgroup. As the reference for each book in a library is usually electronically stored, the sample can be generated quickly.
What is stratified sampling?
How to take a stratified sample
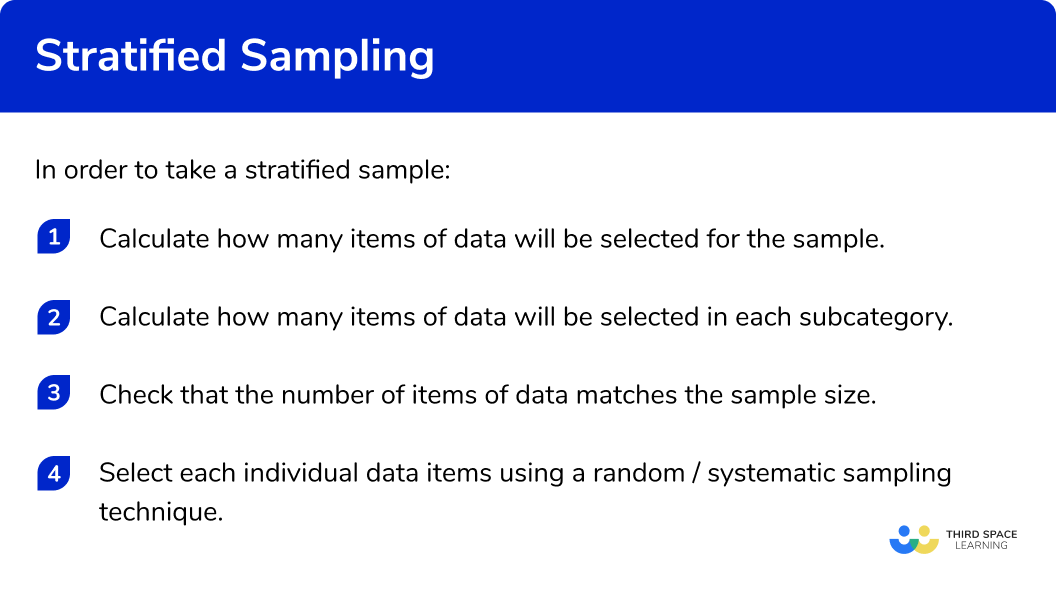
In order to take a stratified sample:
- Calculate how many items of data will be selected for the sample.
- Calculate how many items of data will be selected in each subcategory.
- Check that the number of items of data matches the sample size.
- Select each individual data items using a random / systematic sampling technique.
How to take a stratified sample
Types of sampling methods worksheet (includes stratified sampling)
Get your free stratified sampling worksheet of 20+ types of sampling methods questions and answers. Includes reasoning and applied questions.
DOWNLOAD FREE Types of sampling methods worksheet (includes stratified sampling)
Get your free stratified sampling worksheet of 20+ types of sampling methods questions and answers. Includes reasoning and applied questions.
DOWNLOAD FREERelated lessons on types of sampling methods
Stratified sampling is part of our series of lessons to support revision on types of sampling methods. You may find it helpful to start with the main types of sampling methods lesson for a summary of what to expect, or use the step by step guides below for further detail on individual topics. Other lessons in this series include:
Stratified sampling examples
Example 1: stratified sample
The Student Council is carrying out a survey. They want to collect a stratified sample of 10\% of students in Years 7-11 . Calculate the number of students in each Year Group that will take part in the survey.
| Year 7 | Year 8 | Year 9 | Year 10 | Year 11 | Total |
|---|---|---|---|---|---|
| 342 | 330 | 316 | 346 | 318 | 1652 |
- Calculate how many items of data will be selected for the sample.
As we know that there are 1652 students in the school and the question asks for a sample size of 10\% , we need to calculate 10\% of 1652 :
\frac{1652}{100}\times{10}=165.2
As this number is a decimal, we will round the value to the nearest integer, so we need a sample size of 165 students.
2Calculate how many items of data will be selected in each subcategory.
We will now calculate 10\% of each year group and round each value to the nearest integer, and write the values below the table:
| Year 7 | Year 8 | Year 9 | Year 10 | Year 11 | Total | |
|---|---|---|---|---|---|---|
| 342 | 330 | 316 | 346 | 318 | 1652 | |
| 10\% | 34.2 | 33 | 31.6 | 34.1 | 31.8 | |
| Nearest integer | 34 | 33 | 32 | 34 | 32 |
3Check that the number of items of data matches the sample size.
Adding the number of students in each year group, we get:
34+33+32+34+32=165
which matches the sample size.
Example 2: stratified sample
Georgia wants to select some pick ‘n’ mix from the sweet shop to share with her friends. The sweets are sold from boxes with the following weights:
| Marshmallow | Fudge | Jellies | Fizzy Bottles | Chocolate Drops | Total |
|---|---|---|---|---|---|
| 400g | 1.2kg | 900g | 1kg | 800g | 4.3kg |
Georgia wants to take 15\% of sweets, proportional to their weight. Calculate how many grams of each sweet she will choose. Assume that each sweet is whole.
As we know that the total weight is 4.3kg (or 4300g ), we need to calculate 15\% of this total number:
\frac{4300}{100}\times{15}=645\text{g}
So in total, Georgia wants 645g of sweets.
We now need to calculate 15\% of each type of sweet.
| Marshmallow | Fudge | Jellies | Fizzy Bottles | Chocolate Drops | Total | |
|---|---|---|---|---|---|---|
| 400g | 1.2kg (1200g) | 900g | 1kg (1000g) | 800g | 4.3kg (4300g) | |
| 15\% | 60g | 180g | 135g | 150g | 120g |
Adding the weight of each type of sweet in the sample size, we get:
60+180+135+150+120=645g
which matches the sample size.
Example 3: stratified sample
An insurance company is completing some research. They want to ask 60\% of their staff about their current working hours. Below is a table of the number of staff in each department across the business:
| Number of staff | |
|---|---|
| Customer Service | 240 |
| Sales and Marketing | 100 |
| Operations | 40 |
| Management | 80 |
| Finance | 60 |
Use a stratified sampling technique to find the number of staff in each category for the sample.
A quick sum of the number of staff in each department, we get:
240+100+40+80+60=520.
As we need to collect a sample size of 60\% , we need to calculate 60\% of 520 :
\frac{520}{100}\times{60}=312
We need a sample size of 312 staff.
We now need to calculate the number of staff in each department for the sample:
| Number of staff | 60\% | |
|---|---|---|
| Customer Service | 240 | 144 |
| Sales and Marketing | 100 | 60 |
| Operations | 40 | 24 |
| Management | 80 | 48 |
| Finance | 60 | 36 |
Adding the number of staff in each department, we get the sample size:
144+60+24+48+36=312.
Example 4: stratified sample
Julie is a Lexicographer. She is curious about the average length of words in a book. The book has 4 chapters. Below is a table showing the number of words in each chapter:
| Chapter | Number of words |
|---|---|
| 1 | 1450 |
| 2 | 1182 |
| 3 | 1746 |
| 4 | 1098 |
Julie would like to take a stratified sample of 20\% of the number of words in the book, proportional to the number of words in each chapter. Determine how many words she should collect in each chapter.
Let’s calculate how many words there are in the book:
1450+1182+1746+1098=5476
As we need a sample size of 20\% , the number of words in the sample should be:
\frac{5476}{100}\times{20}=1095.2
As we cannot have 0.2 of a word, we round the number to the nearest integer, which in this case is 1095 .
We will now calculate 20\% of each chapter and round each value to the nearest integer (0dp) , and write the values below the table:
| Chapter | Number of words | 20\% | Nearest integer |
|---|---|---|---|
| 1 | 1450 | 290 | 290 |
| 2 | 1182 | 236.4 | 236 |
| 3 | 1746 | 349.2 | 349 |
| 4 | 1098 | 219.6 | 220 |
Adding the number of words in the sample, we get
290+236+349+220=1095
which matches the sample size.
Example 5: stratified sample
Craig would like to survey 100 people from the population. He has grouped the population into a two way table:
| Population | Male | Female |
|---|---|---|
| Right handed | 143 | 152 |
| Left handed | 15 | 17 |
Calculate how many people should be chosen from each group.
As stated in the question, we want 100 people in the sample.
As we need 100 people, we need to determine what proportion from each category we are selecting. This is found by dividing the number of people in the sample by the number of people in the population. The number of people in the population is equal to 143+152+15+17=327 , so we can now calculate the proportion of each category:
\frac{\text{Sample size}}{\text{Population size}}=\frac{100}{327}
By multiplying each value in the two way table by the fraction \frac{100}{327} , we will calculate the number of people in the sample proportional to the population:
| Sample | Male | Female |
|---|---|---|
| Right handed | 143\times\frac{100}{327} | 152\times\frac{100}{327} |
| Left handed | 15\times\frac{100}{327} | 17\times\frac{100}{327} |
| Population | Male | Female |
|---|---|---|
| Right handed | 44 | 46 |
| Left handed | 5 | 5 |
Adding the total values in each subcategory, we get:
44+46+5+5=100
which matches the sample size.
Common misconceptions
- Mixing up a sampling method
Using the incorrect sampling method to select data (such as using systematic sampling or non random sampling)
- Incorrect percentages / fraction of an amount
When finding a sample of 60\% of the population, you need to find 60\% of each category, and not 60\% of the population and divide it equally between the number of categories. The larger the frequency in the category, the larger the sample taken. This is proportional representation.
- Incorrect number of items in the sample
Remember to check that the sample size matches the total sum of the samples from each category in the population.
Practice stratified sampling questions
1. A football club is completing research on their players. They want a stratified sample, proportional to their ages. Determine how many players will be asked in the missing category, x .
| Age (y years) | Number of players | Number of players in the sample |
| 5y < 11 | 40 | 10 |
| 11y < 14 | 52 | 13 |
| 14y < 16 | 36 | x |
| 16y < 21 | 20 | 5 |


25\%\text{ of }36=\frac{36}{100}\times{25}=9
2. A university is hosting a film night and want to find out what genre of films the students like. They decide to take a stratified sample of students based on the distance their accommodation is from the Student Union. Determine how many students live in the category 3\leq D<5km .
| Distance (D km) | Number of students | Number of students in the sample |
| D < 1 | 1200 | 360 |
| 1 < D < 3 | 1500 | 450 |
| 3 < D < 5 | x | 390 |
| D > 5 | 400 | 120 |
\frac{390}{30}\times{100}=1300\text{ students.}
3. A cafe is investigating the popularity of hot drinks. During one week, they sell 1400 hot drinks. A stratified sample of 60\% of the hot drink sales is taken and the results are shown in the table below. Determine an estimate for the number of cups of tea sold during that week.
| Hot drink | Number in sample |
| Cup of tea | 220 |
| Espresso | 180 |
| Latte | 95 |
| Cappuccino | 160 |
| Hot chocolate | 185 |
366.66… = 367 (0dp).
4. A company is analysing their stock sales from a recent launch. They have a list of all their stock in order of the number of items sold. Their stock can be divided into categories: Menswear, Womenswear, Childrenswear, and Footwear. Describe how they should take a stratified sample of 20\% to find how much of each category of clothing was sold.
Find 20\% of the total amount of stock, use a random number generator to select the first item then select every 5^\text{th} item in the list.
Split the stock list into the four categories. Calculate 20\% of each category for the sample. Use a random number generator to select the items of data.
Assign each item of data a unique reference number. Use a random number generator to select the items of data that total 20\% of the total amount.
Divide the total number of items into 4 , find 20\% of each category.
Split the stock list into the four categories. Calculate 20\% of each category for the sample. Use a random number generator to select the items of data.
Stratified Sampling Technique
Stratified sampling GCSE questions
1. (a) The table below shows the number of students in each year group at a school.
| Year group | 7 | 8 | 9 | 10 | 11 | Post 16 |
| Number of students | 300 | 320 | 320 | 316 | 298 | 150 |
Rowan is completing a study for the school newspaper. He uses a stratified sample of 80 students according to their year group. How many students should feature in his research from Year 9 ?
(b) State one advantage and one disadvantage to Rowan’s sample size.
(5 marks)
(a)
\frac{80}{360}=\frac{2}{9}
(1)
\frac{2}{9}\times{320}=71.1…(1)
71 students in Year 9
(1)
(b)
Advantage – small so saves time to collect sample.
(1)
Disadvantage – may not be representative of the population.
(1)
2. (a) Below is a two-way table giving information on people who use public transport to get to work.
| Male | Female | |
| Uses public transport | 276 | 114 |
| Does not use public transport | 135 | 202 |
Yusif wants to interview a random sample of 100 of these people stratified by gender and whether they do/not use public transport.
Work out the number of people in the sample that are female and do not use public transport.
(b) Without doing any calculation, will the number of males in the sample who do use public transport be greater, or less than your answer to part a)? Explain why.
(5 marks)
(a)
727 people in total
(1)
\frac{202}{727}\times{100}=27.785\quad\text{(3dp)}(1)
28 female & do not use public transport
(1)
(b)
Greater
(1)
The number of males who use public transport in the population (276) is larger than the number of females that do not use public transport (202)
(1)
3. Explain how you would take a stratified sample of 20\% for the following table of data:
| Spanish | German | French | |
| Number of students studying… | 120 | 100 | 150 |
(4 marks)
Calculate the sample size (370)
(1)
Find 20\% of 270 (54)
(1)
Find 20\% of each category (S=24 G=20 F=30)
(1)
Use a random sample to select students in each category
(1)
Learning checklist
You have now learned how to:
The next lessons are
Still stuck?
Prepare your KS4 students for maths GCSEs success with Third Space Learning. Weekly online one to one GCSE maths revision lessons delivered by expert maths tutors.

Find out more about our GCSE maths tuition programme.