High Impact Tutoring Built By Math Experts
Personalized standards-aligned one-on-one math tutoring for schools and districts
In order to access this I need to be confident with:
Converting fractions, decimals and percentages Frequency tables Types of data Adding and subtracting decimals Adding and subtracting fractionsRelative frequency
Here you will learn about relative frequency, including how to calculate it.
Students will first learn about relative frequency as a part of statistics and probability in grade 7 and will expand on their knowledge throughout high school.
What is relative frequency?
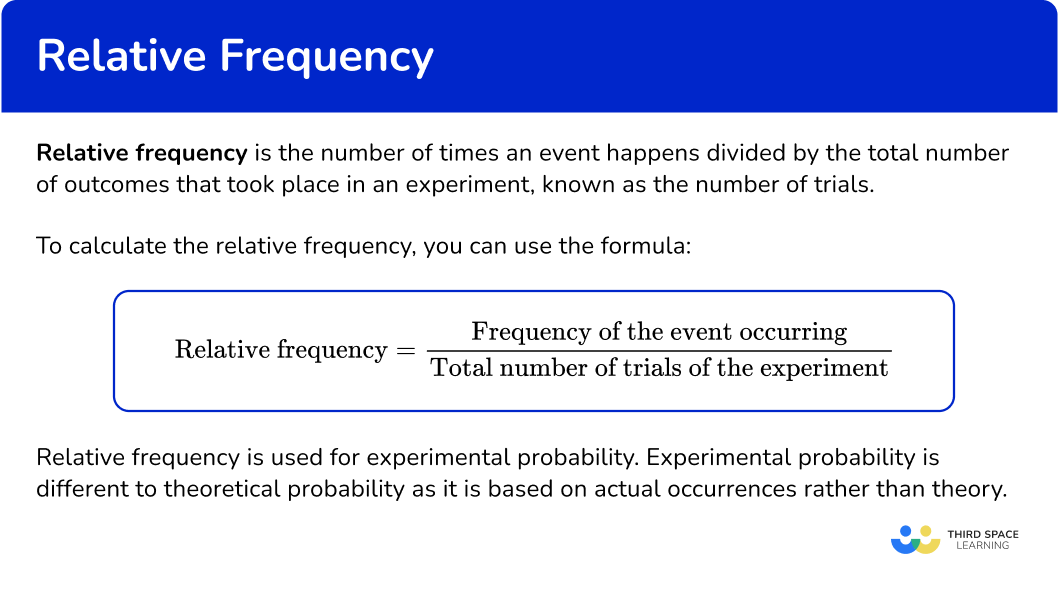
Relative frequency is the number of times an event happens divided by the total number of outcomes that took place in an experiment, known as the total number of trials or the total number of observations. A frequency, or frequency count, is the number of times a value of the data happens.
To calculate the relative frequency, you can use the formula:
\text{Relative frequency}=\cfrac{\text{Frequency of the event occurring}}{\text{Total number of trials of the experiment}}For example,

Jo made a four-sided spinner out of an index card and a pencil. She spun the spinner 50 times and the spinner landed on a three 15 times. Calculate the relative frequency of the spinner landing on a three.
Relative frequency of landing on a three = \cfrac{15}{50} or \cfrac{3}{10} or 0.3 or 30 \%.
The more times an experiment is carried out, the more reliable the relative frequency will be and closer to the theoretical probability. Relative frequency is used for experimental probability. Experimental probability is different to theoretical probability as it is based on actual occurrences rather than theory.
![[FREE] Probability Check for Understanding Quiz (Grade 7 to 12)](https://thirdspacelearning.com/wp-content/uploads/2023/07/Probability-check-for-understanding-quiz-listing-image.png)
[FREE] Probability Check for Understanding Quiz (Grade 7 to 12)
Use this quiz to check your grade 7 to 12 students’ understanding of probability. 15+ questions with answers covering a range of 7th to 12th grade probability topics to identify areas of strength and support!
DOWNLOAD FREE [FREE] Probability Check for Understanding Quiz (Grade 7 to 12)
Use this quiz to check your grade 7 to 12 students’ understanding of probability. 15+ questions with answers covering a range of 7th to 12th grade probability topics to identify areas of strength and support!
DOWNLOAD FREERelative frequency distribution
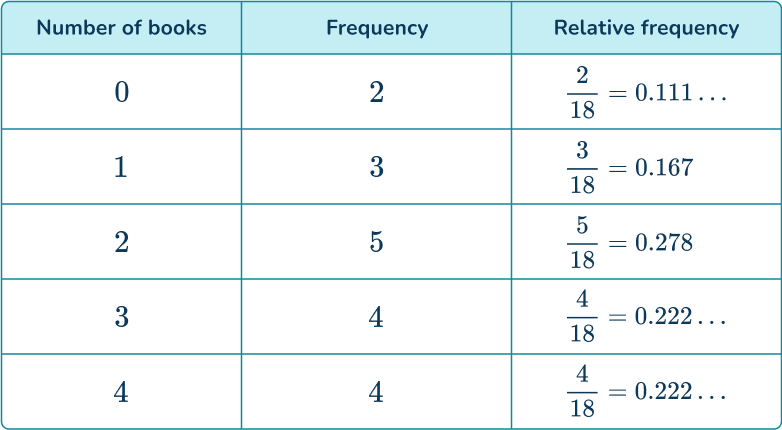
A relative frequency distribution is a summary of a dataset showing the relative frequency of various categories in a given scenario. The summary often begins in a relative frequency table and then is turned into a visual representation, such as a bar chart or pie chart.
For example,
An English teacher tracked the number of books read by a total number of students over a period of time.
What is relative frequency?
Common Core State Standards
- Grade 7: Statistics and Probability (7.SP.C.7)
Develop a probability model and use it to find probabilities of events. Compare probabilities from a model to observed frequencies; if the agreement is not good, explain possible sources of the discrepancy.
a) Develop a uniform probability model by assigning equal probability to all outcomes, and use the model to determine probabilities of events.
For example, if a student is selected at random from a class, find the probability that Jane will be selected and the probability that a girl will be selected.
b) Develop a probability model (which may not be uniform) by observing frequencies in data generated from a chance process.
For example, find the approximate probability that a spinning penny will land heads up or that a tossed paper cup will land open-end down. Do the outcomes for the spinning penny appear to be equally likely based on the observed frequencies?
How to calculate relative frequency
In order to calculate relative frequency:
- Find the number of times the event occurs.
- Find the number of trials of the experiment.
- Use the relative frequency formula and write your answer as a fraction, decimal or percentage.
Relative frequency examples
Example 1: calculating relative frequency
A coin is flipped 50 times with the coin landing on heads 22 times. Calculate the relative frequency of the coin showing heads.
- Find the number of times the event occurs.
The coin showed heads 22 times.
2Find the number of trials of the experiment.
The coin was flipped 50 times.
3Use the relative frequency formula and write your answer as a fraction, decimal or percentage.
\text{Relative frequency}=\cfrac{\text{Frequency of the event occurring}}{\text{Total number of trials of the experiment}} \begin{aligned}&=\cfrac{22}{50} \\\\ &=0.44 \end{aligned}Example 2: calculating relative frequency
A coin shows heads 15 times having been flipped 40 times. Calculate the relative frequency of the coin showing tails.
If the coin showed heads 15 times, it would have showed tails 25 times as 40-15=25.
The coin was flipped 40 times.
\text{Relative frequency}=\cfrac{\text{Frequency of the event occurring}}{\text{Total number of trials of the experiment}}
\begin{aligned}&=\cfrac{25}{40} \\\\
&=0.625 \end{aligned}
Example 3: calculating the number of trials if relative frequency is known
An experiment rolling a normal 6 -sided dice obtained the number 4 on 32 occasions.
The relative frequency of rolling a 4 was calculated as 0.2. Find the number of times the dice was rolled.
The number 4 was rolled 32 times.
This is what will need to be calculated using step 3. Represent this value using the letter x.
As the relative frequency is given, substitute this and the frequency of rolling a 4 into the formula.
\text{Relative frequency}=\cfrac{\text{Frequency of the event occurring}}{\text{Total number of trials of the experiment}}
\begin{aligned}0.2&=\cfrac{32}{x} \\\\
0.2\times{x}&=32 \\\\
x&=32\div{0.2}=160 \end{aligned}
The number of times the dice was rolled was 160.
Example 4
An experiment rolling a normal 6 -sided dice obtained the number 6 on 40 occasions.
The relative frequency of rolling a 6 was calculated as 0.4. Find the number of times the dice was rolled.
The number 6 was rolled 40 times.
This is what will need to be calculated using step 3. Represent this value using the letter x.
As the relative frequency is given, substitute this and the frequency of rolling a 6 into the formula.
\text{Relative frequency}=\cfrac{\text{Frequency of the event occurring}}{\text{Total number of trials of the experiment}}
\begin{aligned}0.4&=\cfrac{40}{x} \\\\
0.4\times{x}&=40 \\\\
x&=40\div{0.4}=100 \end{aligned}
The number of times the dice was rolled was 100.
Example 5
A 3 sided spinner, numbered 1, \, 2 and 3, is spun 100 times. It lands on 1, \, 25 times, and lands on 2, \, 17 times. Calculate the relative frequency of the spinner landing on 3.
To find the number of times the number 3 was landed on, you will subtract the number of times the spinner landed on the numbers 1 and 2 from the total number of spins.
100-25-17=58
The spinner landed on 3, \, 58 times.
The spinner was spun 100 times.
\text{Relative frequency}=\cfrac{\text{Frequency of the event occurring}}{\text{Total number of trials of the experiment}}
\begin{aligned}&=\cfrac{58}{100} \\\\
&=0.58 \end{aligned}
Example 6
A 4 -sided spinner numbered 1 to 4 is spun n times in an experiment. The spinner lands on 3, \, 45 times.
The relative frequency of the spinner landing on 3 was calculated as \cfrac{36}{100}.
Find the value of n.
The spinner lands on the number 3, \, 45 times.
This will be calculated in step 3. This value is represented by the letter n.
\text{Relative frequency}=\cfrac{\text{Frequency of the event occurring}}{\text{Total number of trials of the experiment}}
\begin{aligned}\cfrac{36}{100}&=\cfrac{45}{n} \\\\
\cfrac{36}{100}\times{n}&=45 \\\\
n&=45\div\cfrac{36}{100}=125 \end{aligned}
The spinner was spun 125 times.
Teaching tips for relative frequency
- While worksheets have their place within the classroom, consider using hands-on activities and practical applications. Allowing students to collect their own data and work to create frequency tables and calculate the relative frequency brings a real-life aspect to the concept.
- Use interactive tools, such as Microsoft Excel or other online tools where students can easily change data to see how the relative frequency changes.
- Allow students to participate in the creation of reviews and study materials. Students may have a different way of explaining steps and understanding of relative frequency.
Easy mistakes to make
- Assuming relative frequency is equal to the theoretical probability
The relative frequency of an event is determined by the number of trials or observations. If an experiment only has a small number of trials, it is possible for the relative frequency to be very different from the theoretical probability of the same event.
For example – if a coin is flipped only 5 times, it is very possible for it to show heads on all 5 occasions.
- Assuming a relative frequency with few trails is a good estimate for the theoretical probability
The more times an experiment is carried out, the more reliable the relative frequency will be and closer to the theoretical probability.
Related probability distribution lessons
- Theoretical probability
- Expected frequency
- Experimental probability
Practice relative frequency questions
1. A coin is flipped 80 times and shows heads 50 times. Find the relative frequency for the coin showing heads, giving your answer as a fraction in its simplest form.


\begin{aligned}&=\cfrac{50}{80} \\\\ &=0.625 \end{aligned}
2. A coin is flipped 60 times and shows tails 24 times. Find the relative frequency for the coin showing tails, giving your answer as a decimal.
\begin{aligned}&=\cfrac{24}{60} \\\\ &=0.4 \end{aligned}
3. A coin is flipped 50 times and shows heads 31 times. Find the relative frequency for the coin showing tails, giving your answer as a fraction.
If the coin shows heads 31 times, it must show tails 19 times as 50-31=19.
\text{Relative frequency}=\frac{\text{Frequency of the event occurring}}{\text{Total number of trials of the experiment}}
=\cfrac{19}{50}
4. A 3 -sided spinner, numbered 1, \, 2 and 3, is spun 200 times. It lands on 1, \, 60 times, and lands on 2, \, 85 times. Calculate the relative frequency of the spinner landing on 3. Give your answer as a fraction in its simplest form.
\text{Relative frequency}=\frac{\text{Frequency of the event occurring}}{\text{Total number of trials of the experiment}}
\begin{aligned}&=\cfrac{55}{200} \\\\ &=\cfrac{11}{40} \end{aligned}
5. A normal 6 -sided dice is rolled 150 times. The relative frequency of the die landing on 2 is 0.36. How many times did the die land on 2?
\begin{aligned}0.36&=\cfrac{x}{150} \\\\ 0.36\times{150}&=x \\\\ x&=54 \end{aligned}
6. A 4 -sided spinner numbered 1 to 4 is spun n times in an experiment. The spinner lands on 3, \, 76 times. The relative frequency of the spinner landing on 3 was calculated as \cfrac{19}{75}. Find the value of n.
\begin{aligned}\cfrac{19}{75}&=\cfrac{76}{n} \\\\ \cfrac{19}{75}\times{n}&=76 \\\\ n&=76\div\cfrac{19}{75}=300 \end{aligned}
Relative frequency FAQs
Relative frequency shows how often a certain value occurs in comparison to the total number of trials, or observations. It is often expressed as a decimal, fraction or percentage.
The concept of relative frequency focuses on individual category proportions and compares the likelihoods within the given data set. Cumulative frequency is the total number of data values up to a certain value, and shows the total count below a particular value.
Cumulative relative frequency is the accumulation of the previous relative frequencies. In order to find this, you would find the sum of all of the previous relative frequencies up to a certain relative frequency.
The next lessons are
Still stuck?
At Third Space Learning, we specialize in helping teachers and school leaders to provide personalized math support for more of their students through high-quality, online one-on-one math tutoring delivered by subject experts.
Each week, our tutors support thousands of students who are at risk of not meeting their grade-level expectations, and help accelerate their progress and boost their confidence.

Find out how we can help your students achieve success with our math tutoring programs.
[FREE] Common Core Practice Tests (3rd to 8th Grade)
Prepare for math tests in your state with these 3rd Grade to 8th Grade practice assessments for Common Core and state equivalents.
Get your 6 multiple choice practice tests with detailed answers to support test prep, created by US math teachers for US math teachers!