High Impact Tutoring Built By Math Experts
Personalized standards-aligned one-on-one math tutoring for schools and districts
In order to access this I need to be confident with:
Types of graphs Linear graph Quadratic graph Cubic function graph Reciprocal graphDirectly proportional graph
Here you will learn about directly proportional graphs as well as inversely proportional graphs, including what proportion graphs are and how to interpret them.
Students will first learn about directly proportional graphs as part of functions in high school.
What are directly proportional graphs?
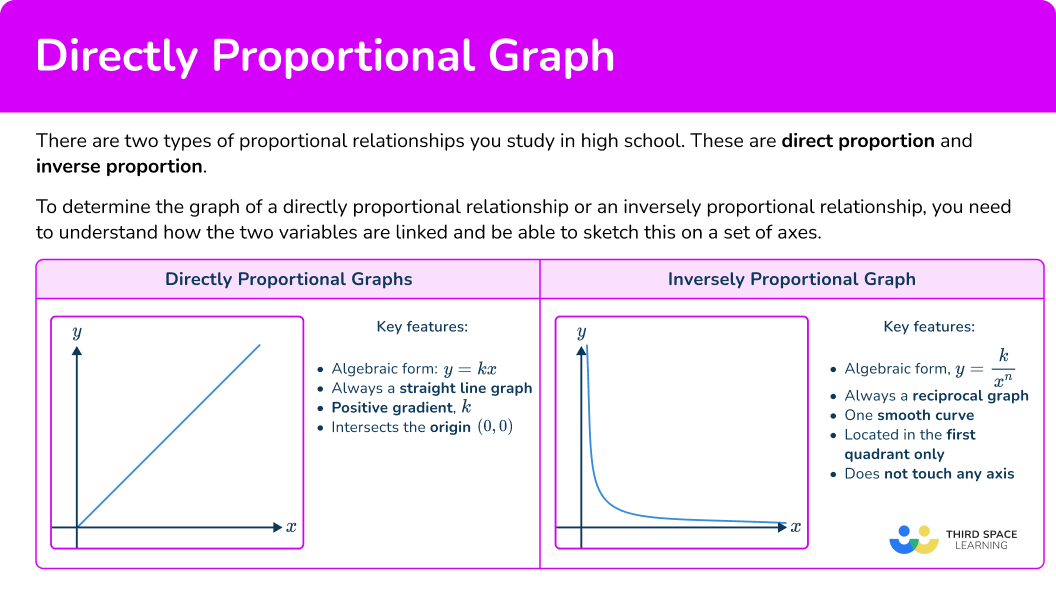
Directly proportional graphs and inversely proportional graphs represent the two types of proportional relationships commonly studied in high school: direct proportion and inverse proportion.
To determine the graph of a directly proportional relationship or an inversely proportional relationship, you need to understand how the two variables are linked and be able to sketch this on a set of axes.
![[FREE] Ratio Check for Understanding Quiz (Grade 6 to 7)](https://thirdspacelearning.com/wp-content/uploads/2023/07/Ratio-check-for-understanding-quiz-listing-image-.png)
[FREE] Ratio Check for Understanding Quiz (Grade 6 to 7)
Teaching directly proportional graph? Use this quiz to check your grade 6 to 7 students’ understanding of ratios. 10+ questions with answers covering a range of 6th and 7th grade ratio topics to identify areas of strength and support!
DOWNLOAD FREE [FREE] Ratio Check for Understanding Quiz (Grade 6 to 7)
Teaching directly proportional graph? Use this quiz to check your grade 6 to 7 students’ understanding of ratios. 10+ questions with answers covering a range of 6th and 7th grade ratio topics to identify areas of strength and support!
DOWNLOAD FREEDirectly proportional graphs
Direct proportion is one type of proportionality relationship. As one value increases, so does the other value. Direct proportion is sometimes known as direct variation.
Direct proportion is useful in numerous real life situations such as exchange rates, buying a quantity of items, work rates, and conversion between units.
For example, the earnings received from selling a greater amount of the same product increases in direct proportion to the number of products sold.
The symbol \propto represents a proportional relationship.
If y is directly proportional to x, you write it as y\propto{x}.
There is also a direct proportion formula that uses the constant k, as the constant of proportionality. The direct proportion formula is
y=kx
Step-by-step guide: Direct variation formula
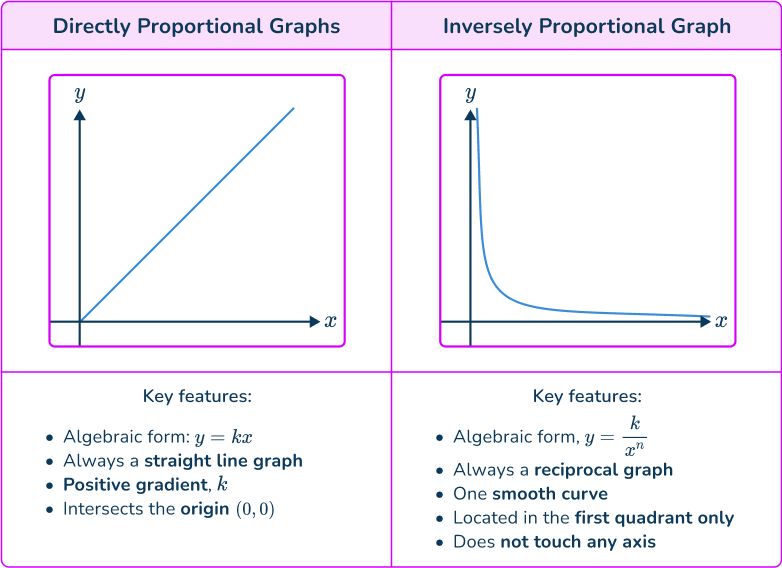
Directly proportional graphs can be straight line graphs:
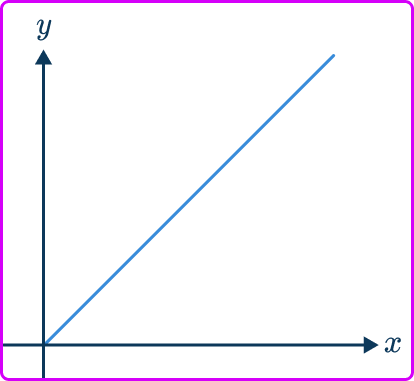
As the variable x increases, the y variable increases, so the straight line continues on the same gradient as x gets larger; conversely, the straight line tends to 0 as x and y get smaller.
The straight line has a positive gradient, k where k=\cfrac{y}{x}, and the line intersects the origin (0, \, 0).
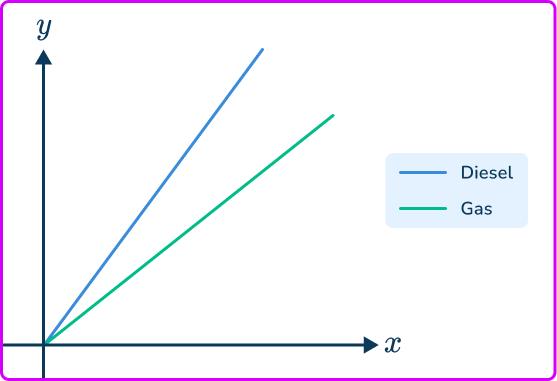
The gradient of the line is steeper if the rate of change is greater (for two different straight lines). For example, let’s look at the cost of gas and diesel.
If the cost of gas is \$ 1.50 per gallon and the cost of diesel is \$ 1.62 per gallon, you can plot a graph to shop the price of different amounts of fuel.
The gradient of the line for diesel will be steeper than the line for gas as the rate of change is greater.
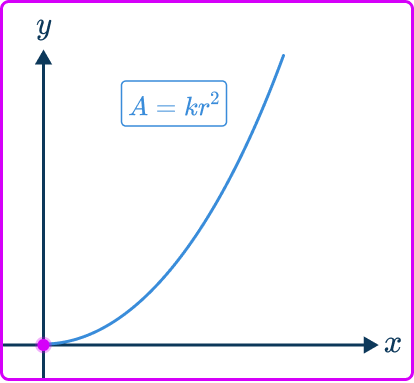
A proportion graph could also be a quadratic, cubic, or involve a root.
The area of a circle is proportional to its radius. A=kr^2. You know that here k=\pi.
The graph would be a quadratic.
Inversely proportional graphs
Inverse proportion is when as one quantity increases the other quantity decreases and vice versa. Inverse proportion is sometimes known as indirect proportion.
For example, consider a job such as painting a fence. If the number of workers increases, then the time taken to do the work decreases. If the number of workers decreases, then the time taken to do the work increases.
If y is inversely proportional to x then you write y\propto\cfrac{1}{x}.
There is also an inverse proportion formula that uses the constant k, as the constant of proportionality. The inverse proportion formula is
y=\cfrac{k}{x}.
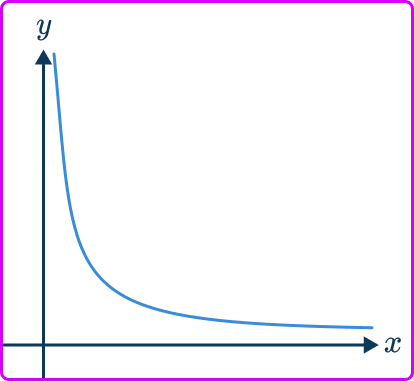
Inversely proportional graphs are reciprocal graphs consisting of one smooth curve in the first quadrant only.
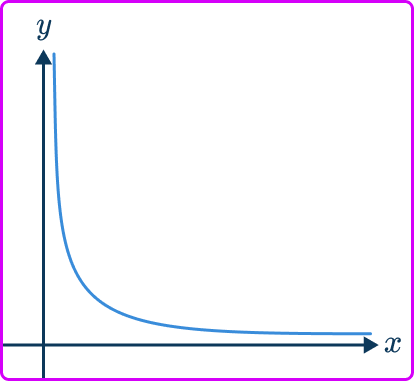
As the variable x increases, the y variable decreases and so the curve tends towards the x -axis as x gets larger; conversely, the curve tends towards the y -axis as x gets smaller. The curve does not touch or intersect either axis at any point.
The graphs for y=\cfrac{k}{x^{2}}, \, y=\cfrac{k}{x^{3}}, \, y=\cfrac{k}{\sqrt{x}}, are all a similar shape to y=\cfrac{k}{x}.

What are directly proportional graphs?
Common Core State Standards
How does this relate to high school math?
- High School – Functions – Interpreting Functions (HS.F.IF.C.7)
Graph functions expressed symbolically and show key features of the graph by hand in simple cases and using technology for more complicated cases.
How to recognize a directly proportional graph
In order to recognize a directly proportional graph or inversely proportional graph:
- Determine the type of proportional relationship.
- Check the key features of the proportion graph.
Directly proportional graph examples
Example 1: recognize directly proportional graph
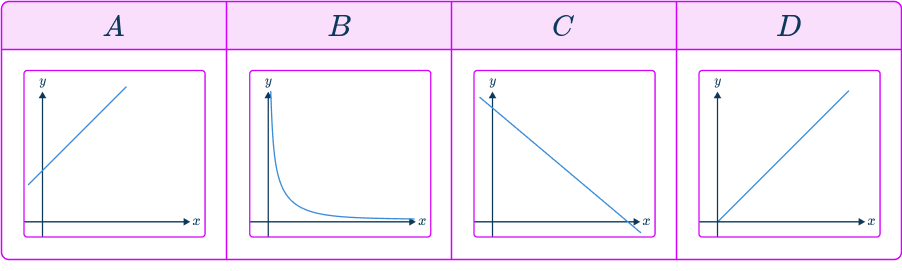
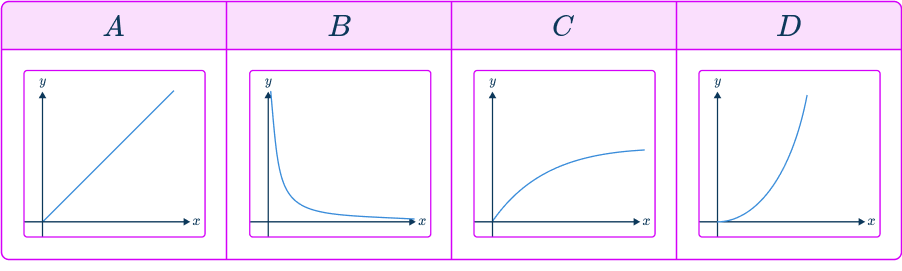
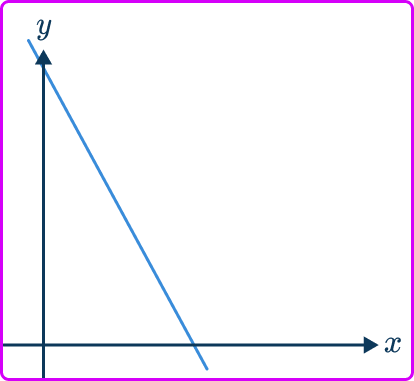
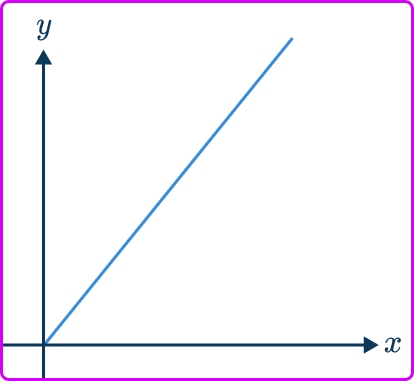
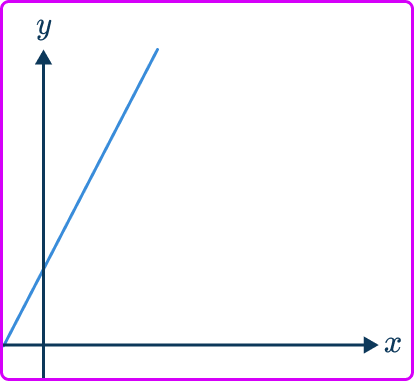
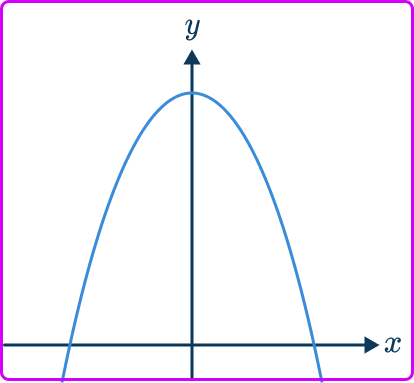
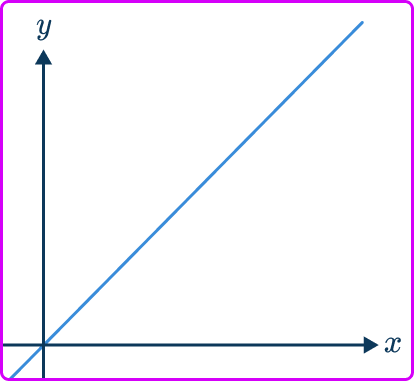
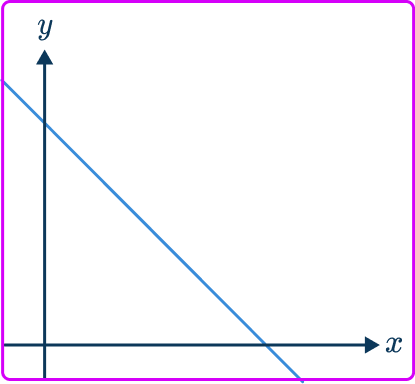
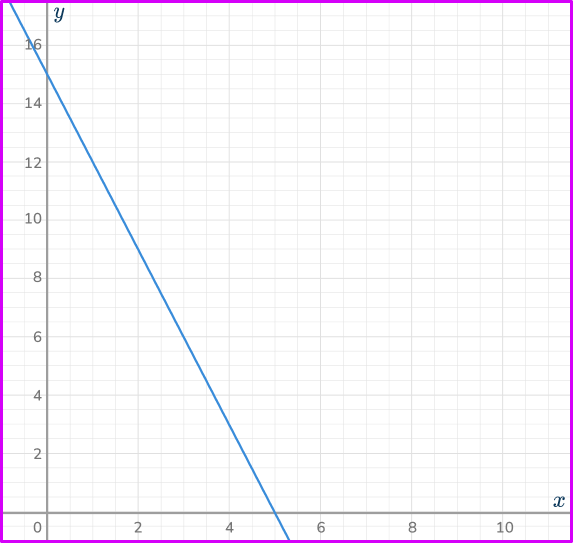
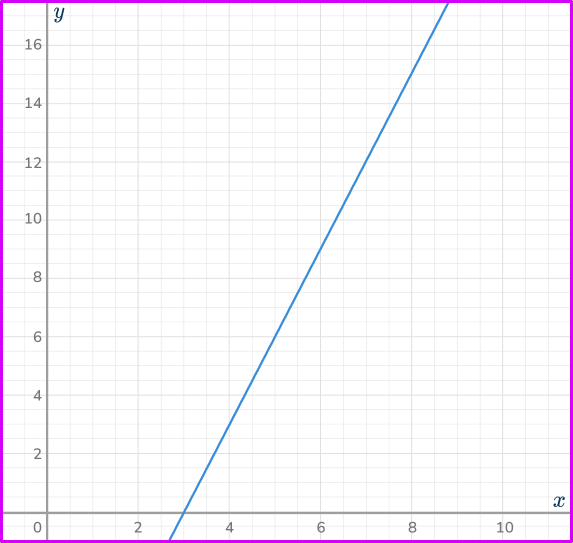
Which of these graphs indicates that y\propto{x}?
- Determine the type of proportional relationship.
As y\propto{x} means y is proportional to x, you are looking for a directly proportional graph.
2Check the key features of the proportion graph.
This direct proportion graph must be a straight line graph in the form y=kx, have a positive gradient. k, and intersect the origin (0, \, 0). The only graph listed that satisfies these three features is D.

Example 2: recognize inversely proportional graph
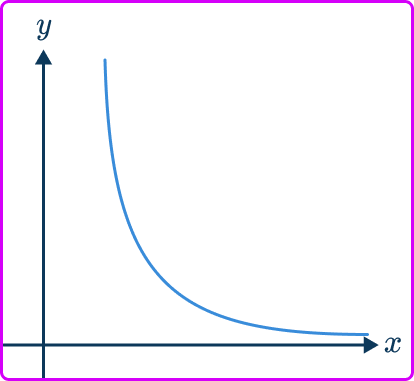
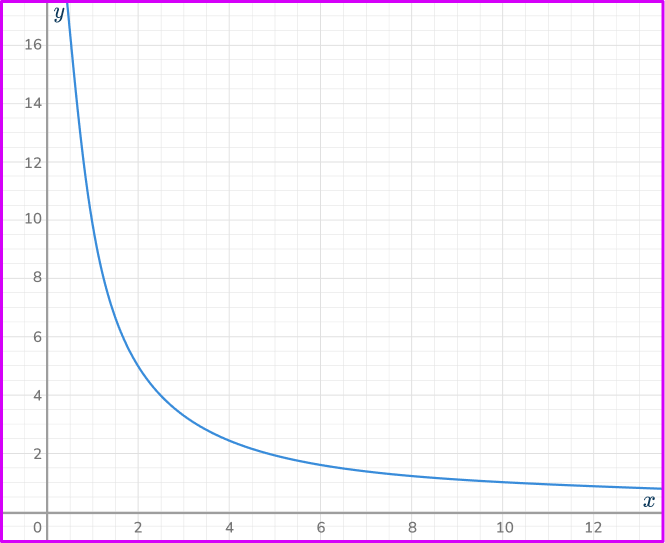
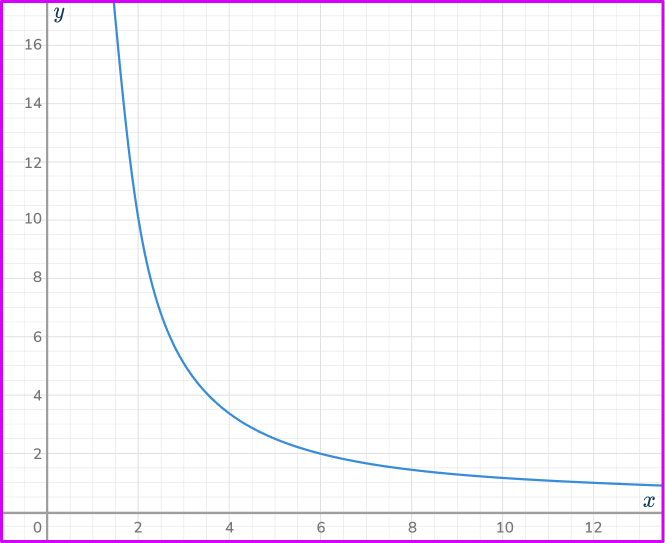
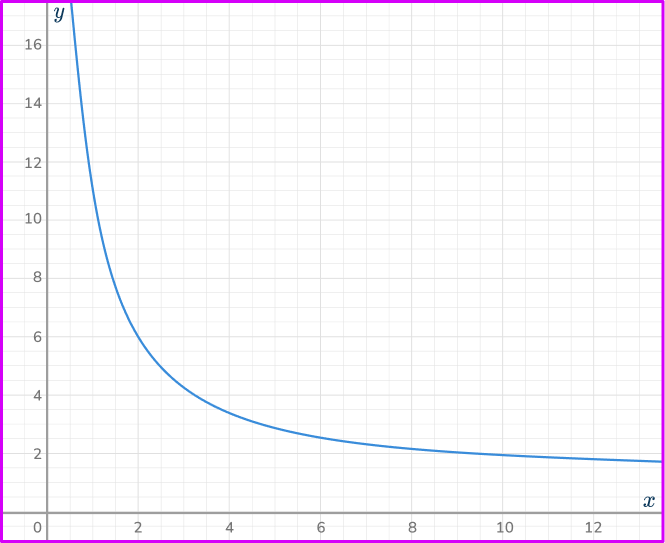
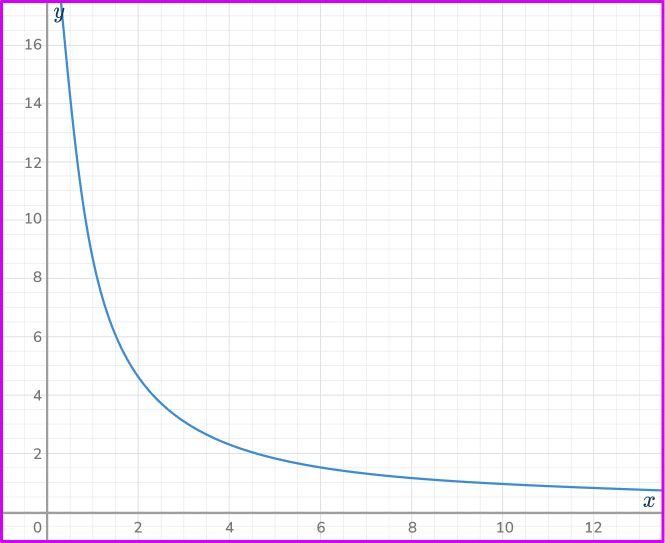
Which of these graphs indicates that y\propto\cfrac{1}{x}?
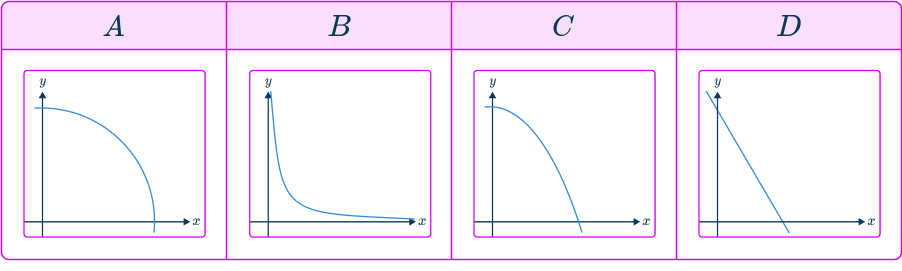
As y\propto\cfrac{1}{x} means y is proportional to the inverse of x, you are looking for an inversely proportional graph.
An inverse proportion graph must be a reciprocal graph that consists of one smooth curve that is located in the first quadrant only and does not touch any axis. The only graph listed that satisfies these features is B.
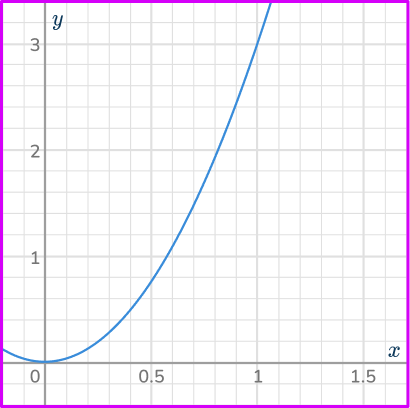
Example 3: recognize directly proportional graph with a power
Which of these graphs indicates that y\propto\sqrt{x}?
As y\propto\sqrt{x} means y is proportional to \sqrt{x}, you are looking for a graph in the form y=k\sqrt{x}.
A, \, C and D all go through (0, \, 0).
A is a straight line.
D is in the shape of a quadratic or cubic
C has the correct shape
C is the graph of y\propto\sqrt{x}

How to use directly proportional graphs
In order to use directly proportional graphs and inversely proportional graphs:
- Locate the value on the correct axis.
- Use straight lines to find the corresponding value from the other axis.
- Read off the corresponding value from the other axis.
Example 4: using a directly proportional graph
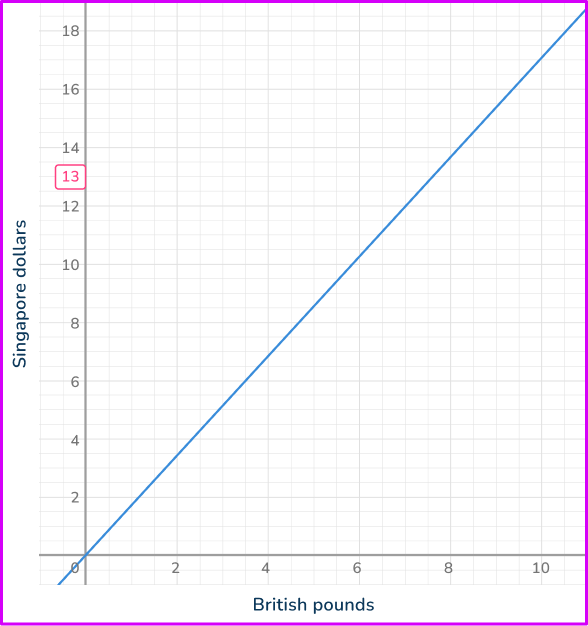
The graph shows the relationship between British pounds and Singapore dollars. Use the graph to estimate the number of British pounds (£) there are for 13 Singapore dollars (\$).

You have been given the value for Singapore dollars (\$ 13), so you need to locate this value on the vertical axis.
Draw a straight line across the graph and then another straight line down to the other axis.
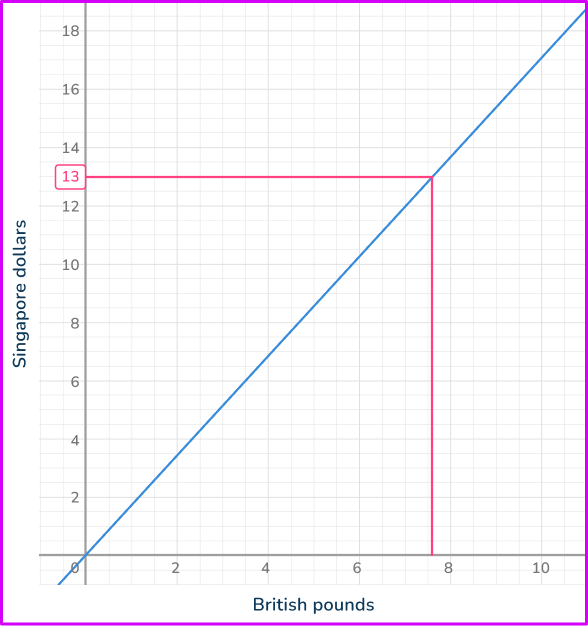
Looking at the horizontal axis, the value you need is approximately 7.6.
\$ 13 is worth approximately £ 7.60.
Example 5: using an inversely proportional graph
The graph shows the relationship between the number of workers and the time taken to complete a job. Use the graph to estimate how long it would take 10 workers to complete the job.
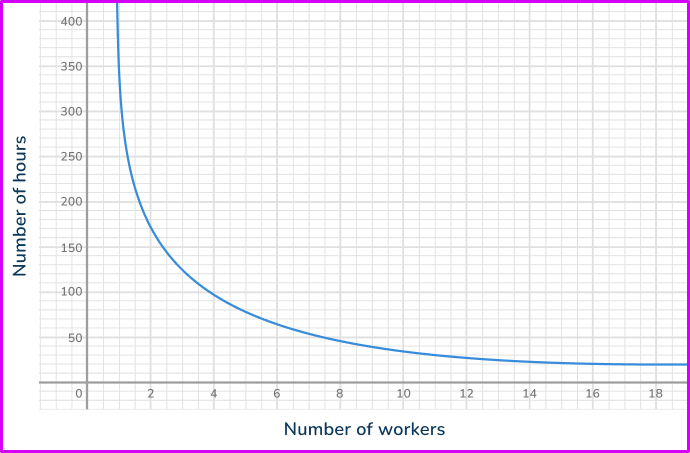
You have been given the value for the number of workers, so you find this value on the horizontal axis.
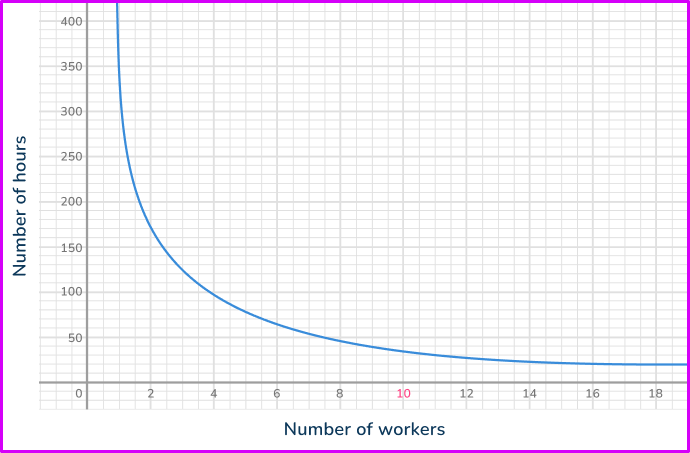
Draw a straight line up to the graph and then another straight line across.
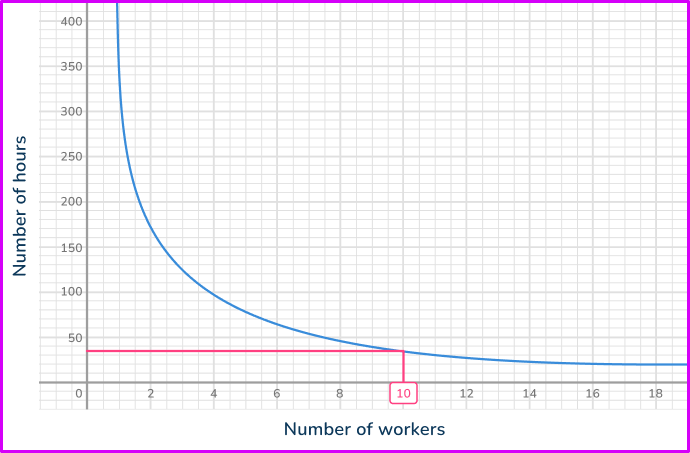
Looking at the vertical axis, the value you need is approximately 35.
If there are 10 workers, the job will take around 35 hours to complete.
How to draw a directly proportional graph
In order to draw a directly proportional graph or inversely proportional graph:
- Calculate the value of some coordinates for the graph.
- Plot the coordinates onto a set of axes.
- Connect the coordinates and extend across the quadrant.
Example 6: drawing a directly proportional graph
Given that y\propto{x}, use the table to draw the graph of the relationship between x and y on the axes provided.
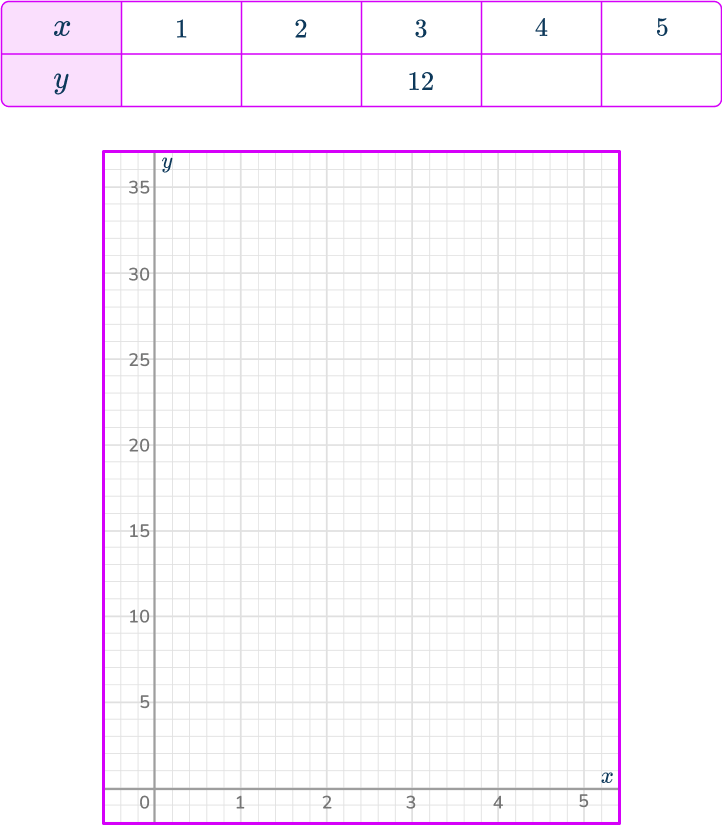
As y\propto{x}, you can write the equation y=kx. As y=12 when x=3, substituting these values into the equation, you have
\begin{aligned}12&=k\times{3} \\\\
12\div{3}&=k \\\\
k&=4 \end{aligned}
So you are plotting the graph of the equation y=4x.
Substituting the other x -values into the equation y=4x, you have
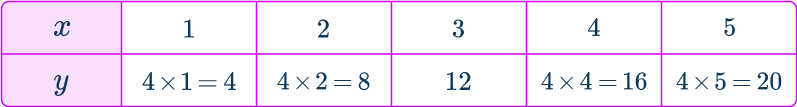
Plotting the coordinates (1, \, 4), \, (2, \, 8), \, (3, \, 12), \, (4, \, 16) and (5, \, 20), you have
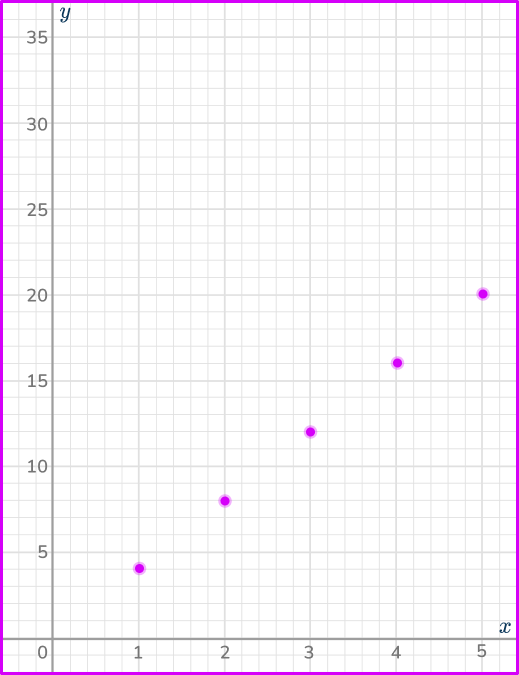
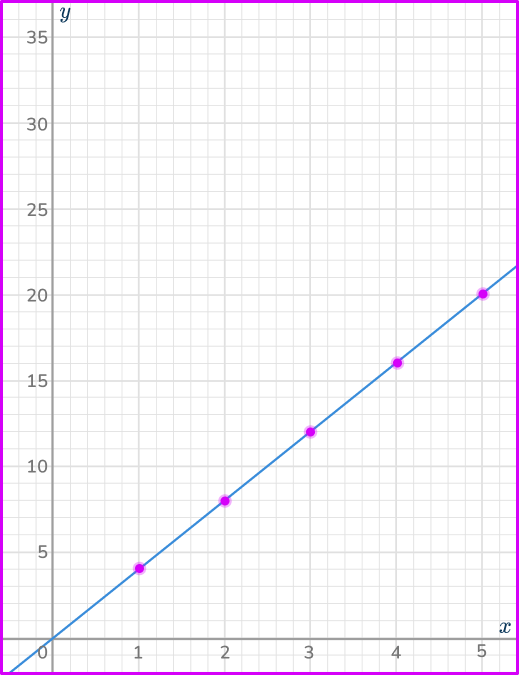
Since the variables are directly proportional, you need to draw a straight line through the coordinates.
Example 7: drawing an inversely proportional graph
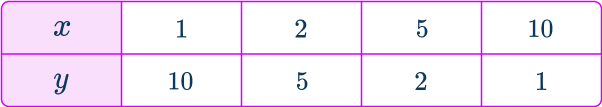
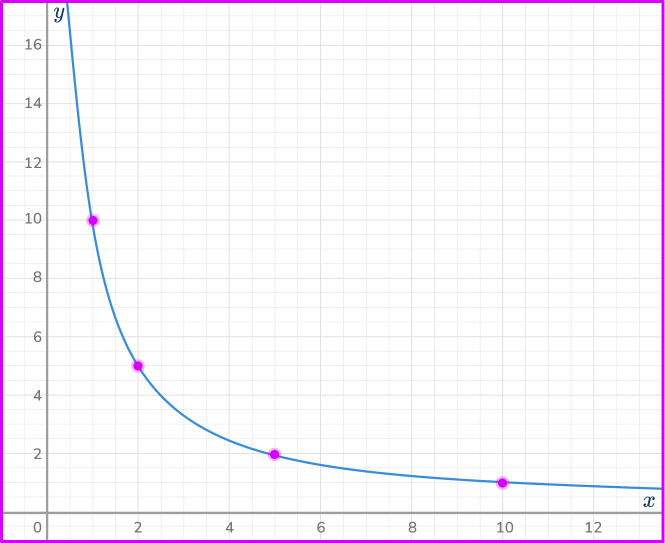
The pair of variables, x and y, are inversely proportional. The equation linking the variables is y=\cfrac{12}{x}. By completing the table, draw the graph of y=\cfrac{12}{x}.
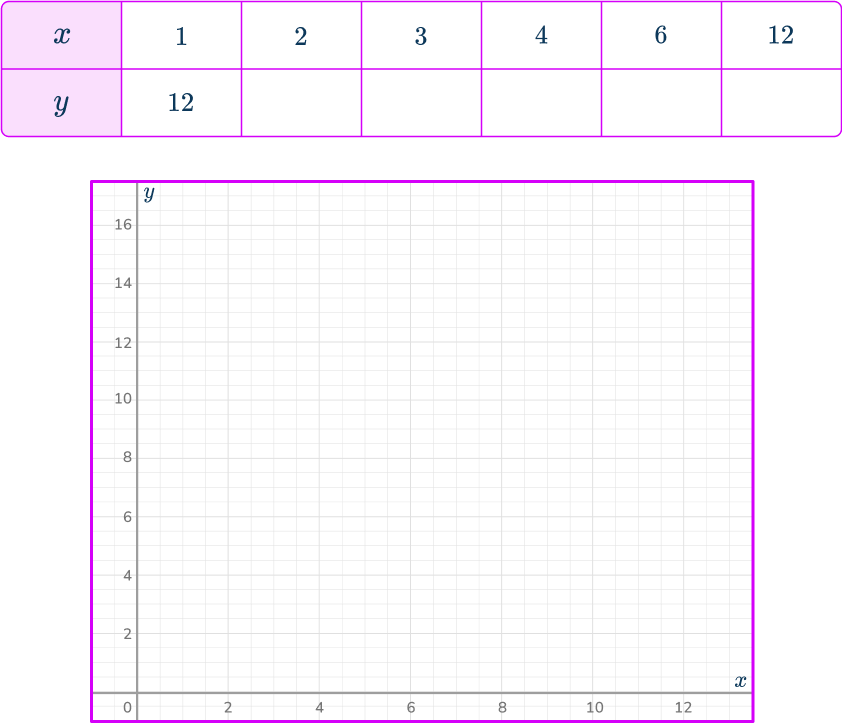
Substituting the x -values into the equation y=\cfrac{12}{x}, you have
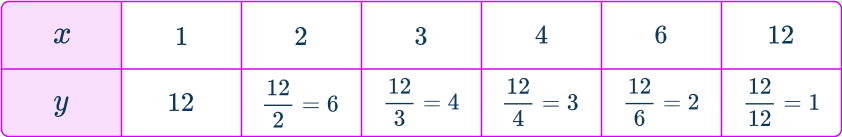
Plotting the coordinates (1, \, 12), \, (2, \, 6), \, (3, \, 4), \, (4, \, 3), \, (6, \, 2), and (12, \, 1), you have
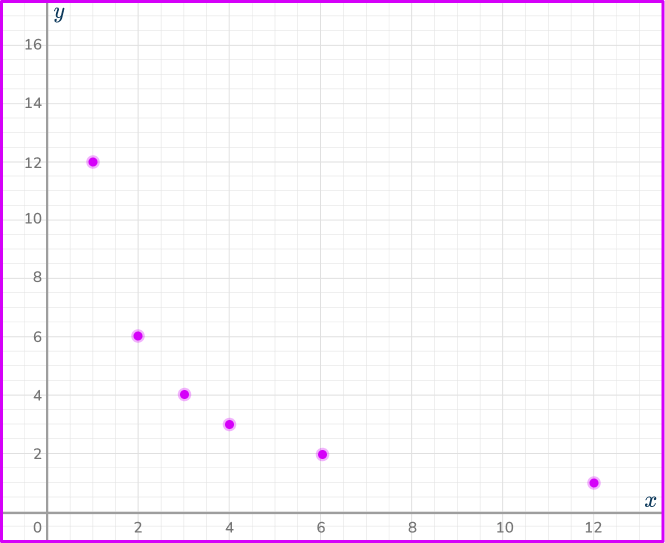
Since the variables are inversely proportional, you need to draw a smooth curve through the coordinates.

Teaching tips for directly proportional graphs
- Use worksheets with relatable examples of direct proportion, such as:
Speed and distance (constant speed: distance = speed \times time).
Price and quantity (buying more items increases cost proportionally).
- Teach students that in a directly proportional graph, the values on the x -axis (independent variable) and the y -axis (dependent variable) always maintain a consistent ratio.
Emphasize that the graph is a straight line that starts at the origin (0, \, 0), showing that when the value of 𝑥 is zero, 𝑦 is also zero. This visual connection helps reinforce the concept of proportionality.
- When teaching inversely proportional graphs, emphasize the relationship between the variables: as x increases, y decreases. Use examples like speed and travel time for a fixed distance. Plot 𝑦=𝑘𝑥 to show the downward curve and emphasize that 𝑥⋅𝑦=𝑘 remains constant.
Easy mistakes to make
- Thinking that directly proportional graph does not intercept the origin
The graph of direct proportion is assumed to simply be a straight line graph and so the y-intercept can vary from the origin. This is not correct. The graph of a directly proportional relationship always intercepts the origin. This is also true for direct proportion graphs in the form y=kx^{n}.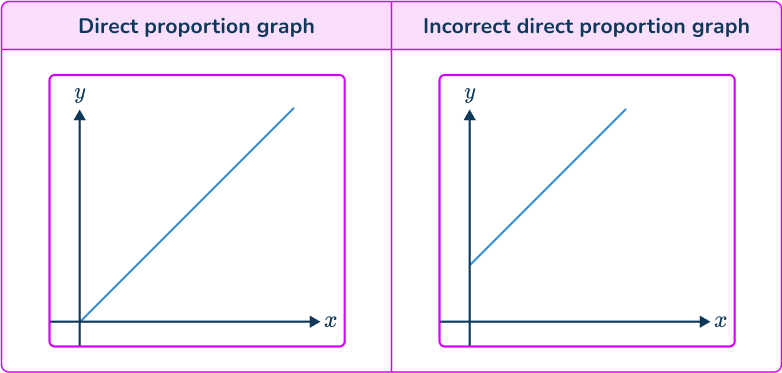
- Assuming that inverse proportion graph intercept any axis
The graph of an inversely proportional relationship is not a straight line with a negative gradient. Also, the graph does not intercept any axis. Be careful when drawing this curve.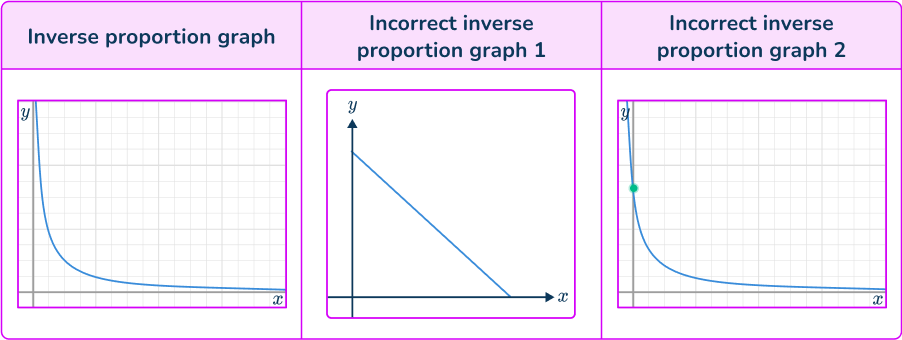
- Confusing graphs representing inverse proportion
Graphs representing inverse proportion can be easily confused with other curves. You are looking for a decreasing curve, as one variable increases the other decreases.
Practice directly proportional graphs questions
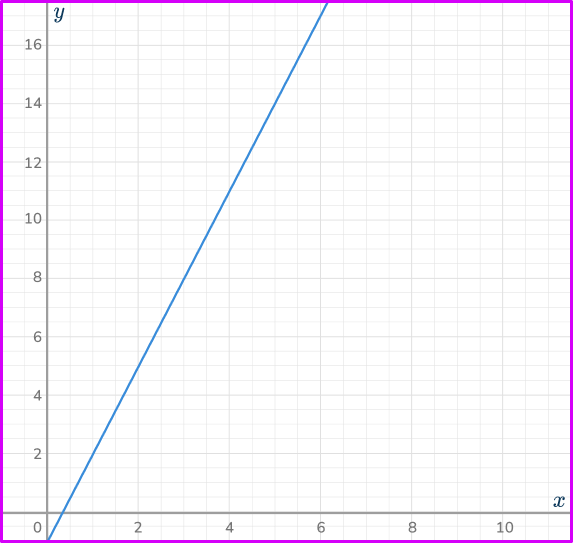
1. Which of these graphs indicates y\propto{x}?


The graph of two variables that are directly proportional have the following features,
- May be a straight line graph, quadratic, cubic or root.
- Intersects the origin (0, \, 0) .
2. Which of these graphs represents the relationship y\propto\cfrac{1}{x}?

The graph of two variables that are inversely proportional have the following features,
- Always a reciprocal graph
- One smooth curve
- Located in the first quadrant only
- Does not touch any axis
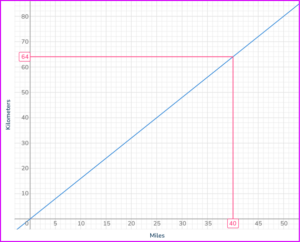
3. The graph shows the relationship between kilometers and miles. Use the graph to find how many kilometers are equivalent to 40 miles.
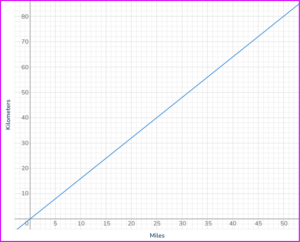
Find 40 miles on the horizontal axis. Draw a vertical line up to the graph, and then a horizontal line across to the other axis. Read off the value from the vertical axis.
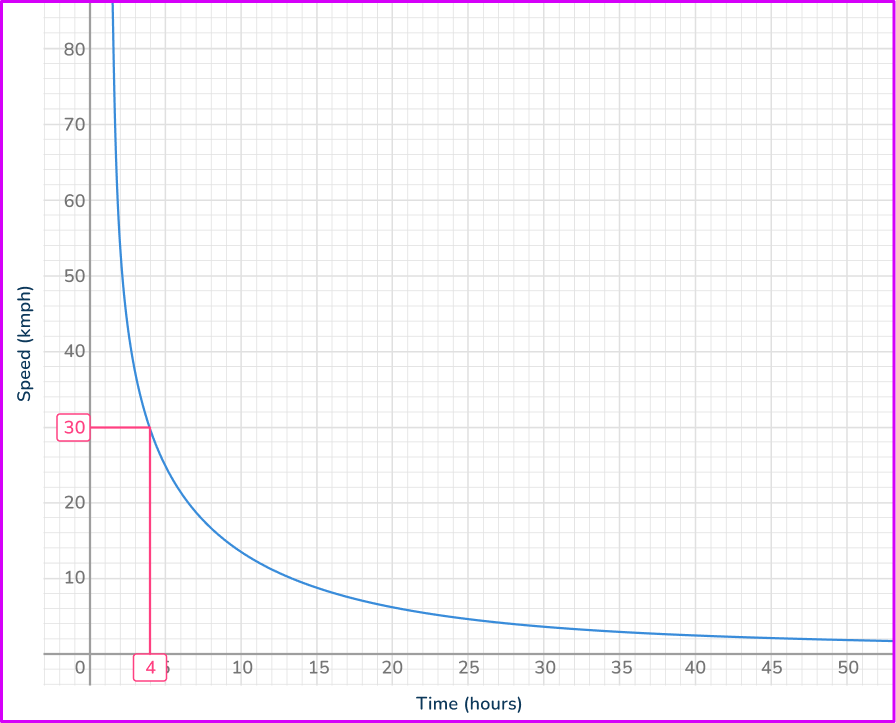
4. The graph shows the relationship between speed and time of a journey. Find the time taken for the journey when the speed is 30 \, km/h.
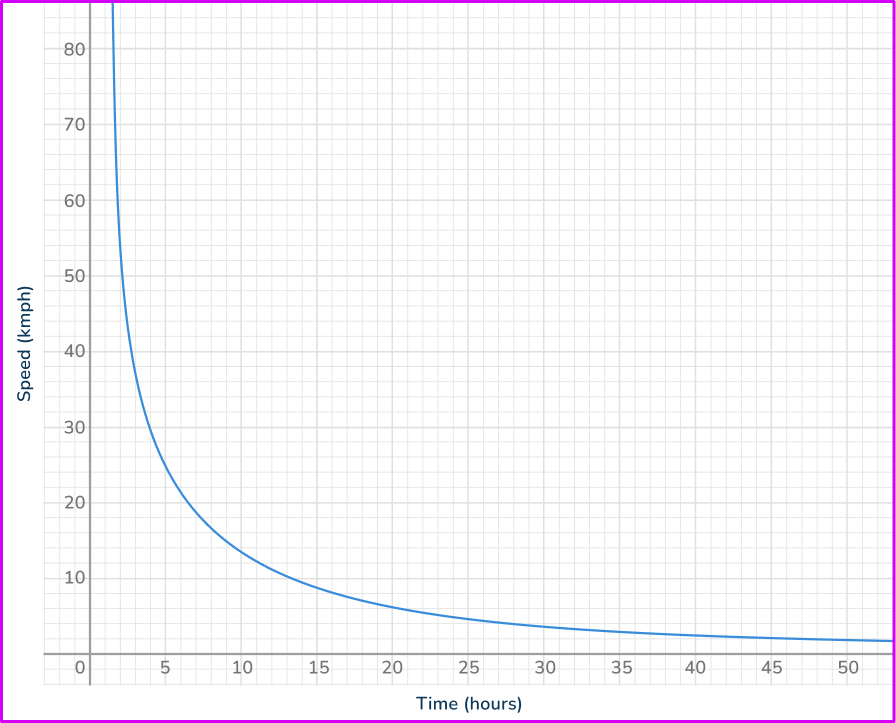
directly-proportional-graphs
Find 30 \, km/h on the vertical axis. Draw a horizontal line across the graph, and then a vertical line down to the other axis. Read off the value from the horizontal axis.
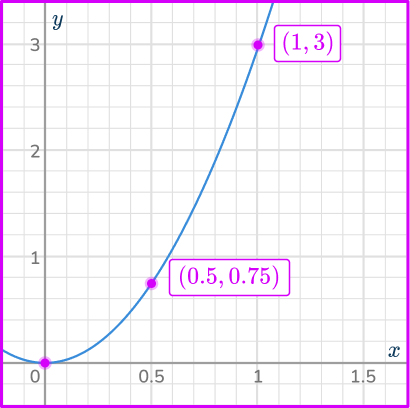
5. Which is the correct graph for the direct proportion relationship y=3x^{2}?
Calculating some coordinates using the equation y=3x^{2}, you have

6. Which is the correct graph for the inverse proportional relationship y=\cfrac{10}{x}?
Calculating some coordinates for the equation y=\cfrac{10}{x}, you have
Directly proportional graph FAQs
A directly proportional graph represents a relationship where two variables increase or decrease at a constant rate. It is expressed by the equation y=kx, where k is the constant of proportionality. The graph is a straight line that passes through the origin (0, \, 0).
An inversely proportional graph represents a relationship where as one variable increases, the other decreases. The equation is y=\cfrac{k}{x}, where k is the constant of proportionality. The graph forms a hyperbola.
The straight line indicates that as one variable increases, the other variable increases at a constant rate. The slope of the line is the constant
𝑘, showing the rate of change between the two variables.
No, a directly proportional graph is always a straight line. Curved graphs represent other types of relationships, such as quadratic or cubic relationships.
The next lessons are
- Converting fractions decimals and percents
- Percent
- Compound measures
Still stuck?
At Third Space Learning, we specialize in helping teachers and school leaders to provide personalized math support for more of their students through high-quality, online one-on-one math tutoring delivered by subject experts.
Each week, our tutors support thousands of students who are at risk of not meeting their grade-level expectations, and help accelerate their progress and boost their confidence.

Find out how we can help your students achieve success with our math tutoring programs.
[FREE] Common Core Practice Tests (3rd to 8th Grade)
Prepare for math tests in your state with these 3rd Grade to 8th Grade practice assessments for Common Core and state equivalents.
Get your 6 multiple choice practice tests with detailed answers to support test prep, created by US math teachers for US math teachers!