High Impact Tutoring Built By Math Experts
Personalized standards-aligned one-on-one math tutoring for schools and districts
In order to access this I need to be confident with:
Types of graphs Plots points on a graphIndependent and dependent variables
SubstitutionQuadratic graphs
Here you will learn all about quadratic graphs including how to draw graphs of quadratic functions from a table of values, identify key points on a graph of a quadratic function, and sketch a graph from these key points.
Student first learn about quadratic graphs in algebra 1 and expand that knowledge as they move through algebra 2.
What are quadratic graphs?
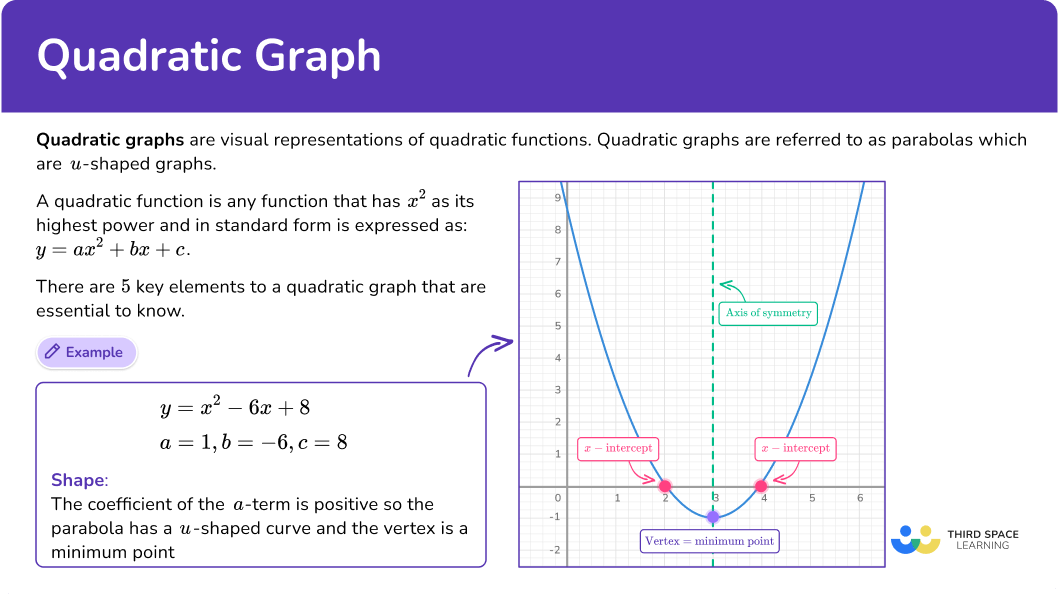
Quadratic graphs are visual representations of quadratic functions. Quadratic graphs are referred to as parabolas which are u-shaped graphs.
A quadratic function is any function that has x^{2} as its highest power and in standard form is expressed as: y=ax^{2}+bx+c .
There are 5 key elements to a quadratic graph that are essential to know.
- Shape ( a coefficient)
- Vertex point
- Axis of symmetry
- y -intercept
- Roots or x -intercepts
Let’s take a closer look at each one of these key features.
![[FREE] Algebra Worksheet (Grade 6 to 8)](https://thirdspacelearning.com/wp-content/uploads/2023/07/Algebra-check-for-understanding-quiz-listing-image-.png)
[FREE] Algebra Worksheet (Grade 6 to 8)
![[FREE] Algebra Worksheet (Grade 6 to 8)](https://thirdspacelearning.com/wp-content/uploads/2023/07/Algebra-check-for-understanding-quiz-listing-image-.png)
Use this quiz to check your grade 6 to 8 students’ understanding of algebra. 10+ questions with answers covering a range of 6th and 8th grade algebra topics to identify areas of strength and support!
DOWNLOAD FREE![[FREE] Algebra Worksheet (Grade 6 to 8)](https://thirdspacelearning.com/wp-content/uploads/2023/07/Algebra-check-for-understanding-quiz-listing-image-.png)
[FREE] Algebra Worksheet (Grade 6 to 8)
![[FREE] Algebra Worksheet (Grade 6 to 8)](https://thirdspacelearning.com/wp-content/uploads/2023/07/Algebra-check-for-understanding-quiz-listing-image-.png)
Use this quiz to check your grade 6 to 8 students’ understanding of algebra. 10+ questions with answers covering a range of 6th and 8th grade algebra topics to identify areas of strength and support!
DOWNLOAD FREEShape
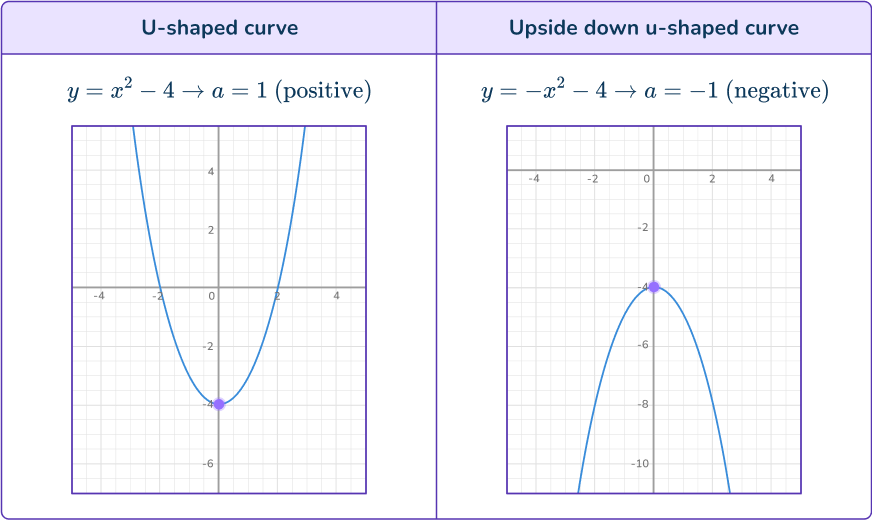
A parabola which is the name of the graph of a quadratic function can either be a u-shaped curve or an upside down u-shaped curve. It depends on the coefficient of the a term of the function.
y=a x^2+b x+c \rightarrow When the a term is positive the parabola looks like a u-shaped curve, when a is negative the parabola looks like an upside down u-shaped curve.
Vertex point
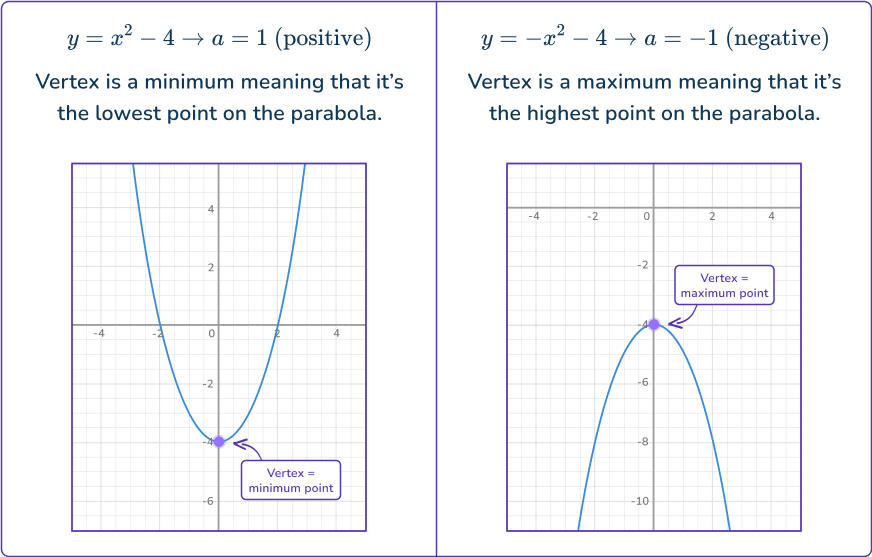
The vertex point of a parabola is either the high point or the low point depending on the shape of the parabola. When the a term is positive, the vertex is the low point of the graph and when the a term is negative, the vertex is the high point of the graph.
You can find the ordered pair of the vertex point, if it’s not clear from the graph, by using x=\cfrac{- \, b}{2 a} to find the x -coordinate and then substituting that x value into the original function to find the y -coordinate, f\left(\cfrac{- \, b}{2 a}\right)=y.
Axis of symmetry
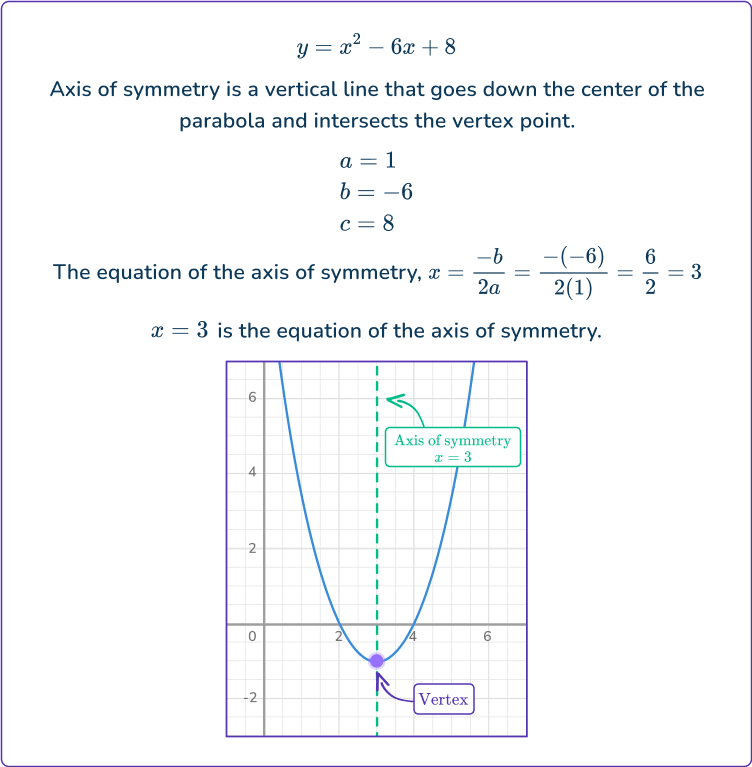
Notice the graphs of the parabolas are all symmetric, meaning that they can be cut down the center vertically where both halves are equal and mirror images of each other.
The vertical line that cuts through the parabola and passes through the vertex is called the axis of symmetry. The axis of symmetry is a vertical line that can be written as x=\cfrac{- \, b}{2 a}.
y -intercept
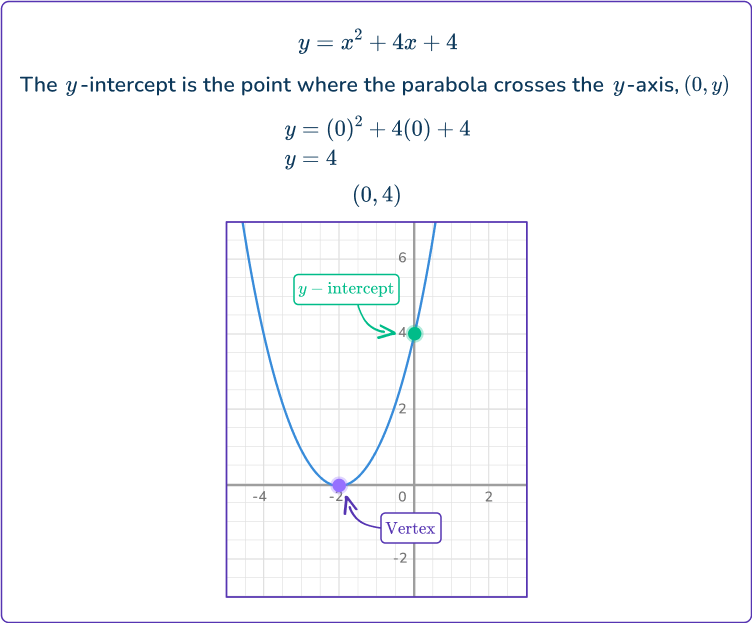
The y -intercept is the point where the parabola crosses the y -axis. The y -intercept can be written as an ordered pair, (0, y).
If the y -intercept is not easy to determine from the graph, you can substitute 0 into the original function for x and solve for the y -value.
Roots or x -intercepts
The roots of a quadratic equation are the same as the x -intercepts.
So, from the graph of the quadratic function, the point or points where the parabola crosses the x -axis are the roots and also the x -intercepts.
If the roots are not easily determined from the graph of the parabola, you can substitute 0 for y into the quadratic function and solve for x.
In order to solve a quadratic equation to find the roots ( x -intercepts) you can factor the quadratic, complete the square or use the quadratic formula.
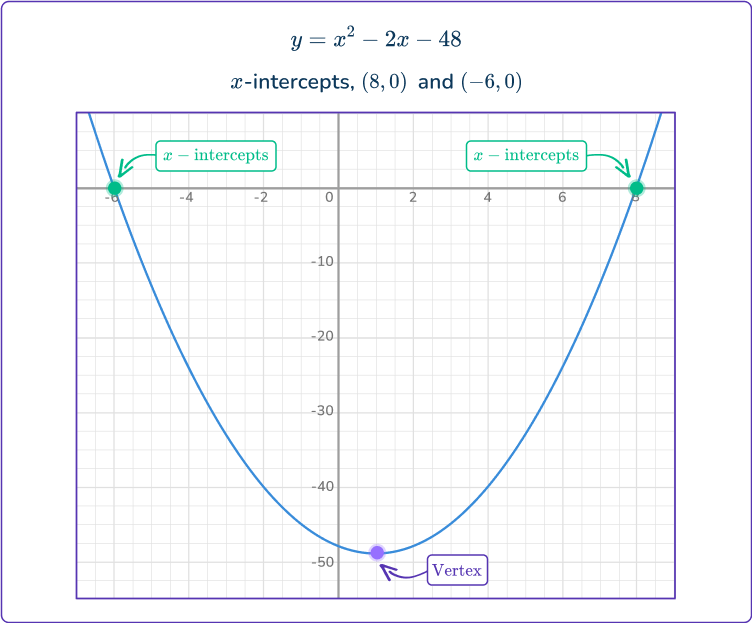
For example, to find the roots of the quadratic equation, y=x^2-2 x-48, first substitute a 0 in for y (because the roots are the x -intercepts).
0=x^2-2 x-48 \rightarrow Then look to factor the quadratic in order to solve.
\begin{aligned}x^2-2 x-48=0 \\\\ (x-8)(x+6)=0 \\\\ x-8=0 & \hspace{0.8cm} x+6=0 \\\\ x=8 & \hspace{0.8cm} x=- \, 6 \end{aligned}The roots of the quadratic are x=8 and x=- \, 6 which also means that the x -intercepts are (8, 0) and (- \, 6, 0).
Step-by-step guide: Solving quadratic equations
Graphing quadratic equations
There are several strategies you can use to graph a quadratic equation. Some of those strategies are:
- Making a table of values
- Using the vertex and two other points
- Using the vertex, y -intercept and x -intercepts
For example, if you want to sketch the graph of the quadratic function f(x)=x^2-36, making a table of values, you can select values for x and substitute them into the function to find the y -values.
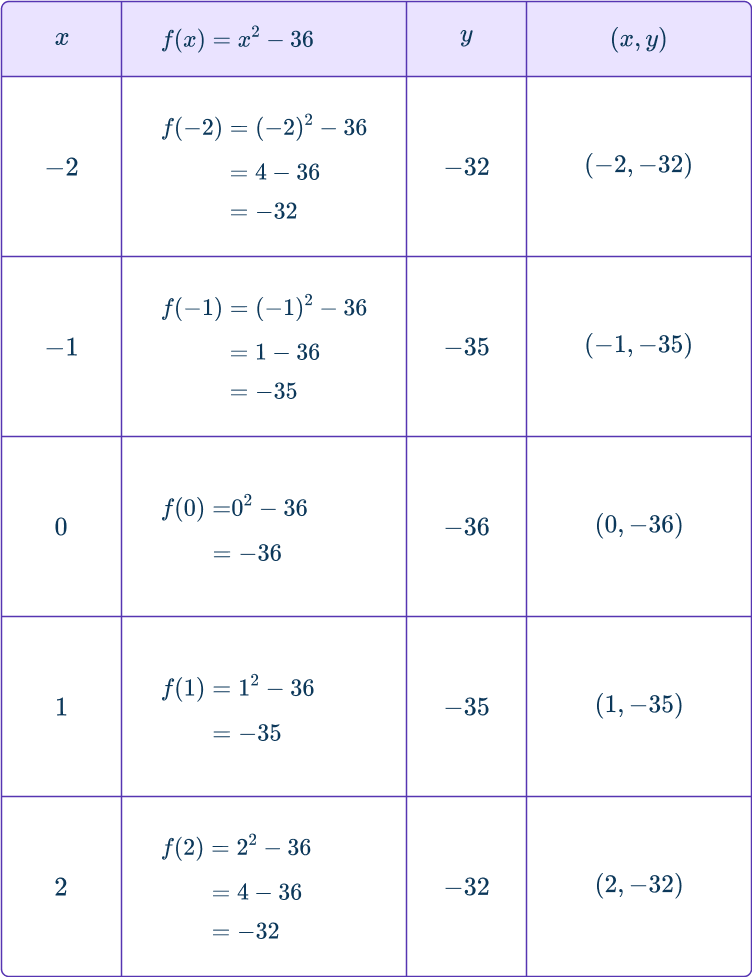
Take the points and plot them on the coordinate plane. Then draw the parabola through the points.

What are quadratic graphs?
Common Core State Standards
How does this apply to high school math?
- High School Functions – Interpreting Functions (HSF.IF.C.7a)
Graph linear and quadratic functions and show intercepts, maxima, and minima.
- High School Functions – Interpreting Functions (HSF.IF.C.8a)
Use the process of factoring and completing the square in a quadratic function to show zeros, extreme values, and symmetry of the graph and interpret these in terms of a context.
How to identify key features of a quadratic from the graph
In order to identify the key features of a quadratic from the graph:
- Identify the coordinates of the vertex and determine if it is a maxima or minima.
- Write the equation of the axis of symmetry.
- Find the coordinates \textbf{y} -intercept and \textbf{x} -intercepts.
Identifying key features of a quadratic examples
Example 1: positive “a” value
Use the parabola to identify the vertex point, describe it as a maximum value or minimum value, axis of symmetry, y -intercept, and x -intercepts.
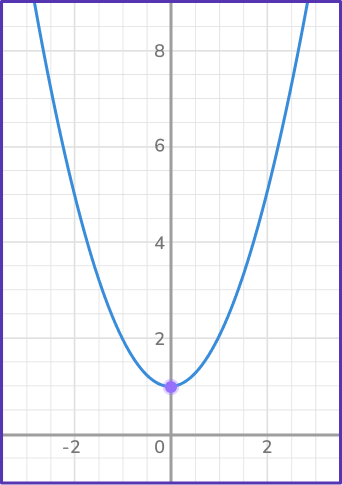
- Identify the coordinates of the vertex and determine if it is a maxima or minima.
From the parabola, you can see that it is a u-shape curve, so the vertex is a minimum point because the y -value is a minimum value (lowest value) at that point.
The coordinates of the vertex are (0, 1).
2Write the equation of the axis of symmetry.
The axis of symmetry is the x -axis so the equation is, x=0.
3Find the coordinates \textbf{y} -intercept and \textbf{x} -intercepts.
The coordinates of the y -intercept are (0, 1).
The parabola does not cross the x -axis so there are not any x -intercepts.
Example 2: negative “a” value
Use the parabola to identify the vertex point, describe the vertex as a maximum value or minimum value, axis of symmetry, y -intercept, and x -intercepts.
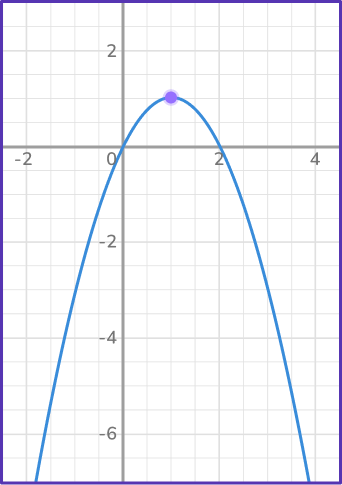
Identify the coordinates of the vertex and determine if it is a maxima or minima.
Since the parabola is in the shape of an upside u-shaped curve, the vertex is a maximum point because the y -value has its highest value at that point.
The ordered pair of the vertex is (1, 1).
Write the equation of the axis of symmetry.
The axis of symmetry is the vertical line, x=1.
Find the coordinates \textbf{y} -intercept and \textbf{x} -intercepts.
The y -intercept is the point (0, 0), also known as the origin.
The x -intercepts are the points (0, 0) and (2, 0).
*Note: When a y -intercept is at the origin, there will also be an x -intercept at the origin.
Example 3: one x -intercept
Use the parabola to identify the vertex point, describe the vertex as a maximum value or minimum value, axis of symmetry, y -intercept, and x -intercepts.
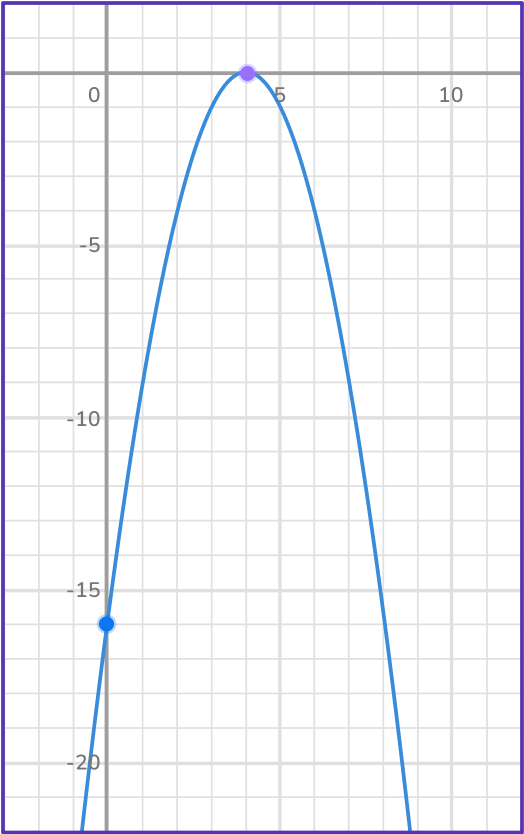
Identify the coordinates of the vertex and determine if it is a maxima or minima.
The vertex is the point (4, 0). It is a maximum point because the parabola is in the shape of an upside down u-shaped curve. It’s a maximum point because the y -value is its highest at that point.
Write the equation of the axis of symmetry.
The axis of symmetry is the vertical line, x=4.
Find the coordinates \textbf{y} -intercept and \textbf{x} -intercepts.
The y -intercept is (0, - \, 16) and there is only one x -intercept which is (4, 0).
How to solve a quadratic by the graph
In order to solve a quadratic equation by the graph:
- Create a table of values to plot the quadratic equation.
- Plot the quadratic equation.
- Identify the \textbf{x} -intercepts.
- State the solution.
Example 4:
Determine the solution(s) to the quadratic equation by graphing.
y=- \, x^2+2 x+3Create a table of values to plot the quadratic equation.
In order to create a table of values, select any values you want for x and substitute them into the equation.
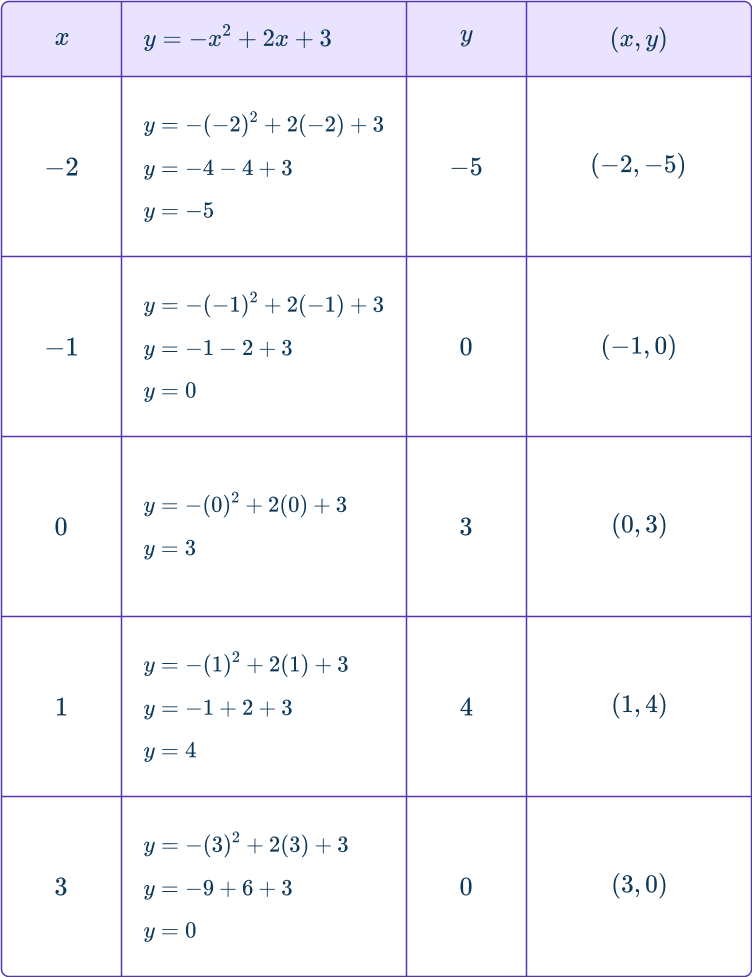
Plot the quadratic equation.
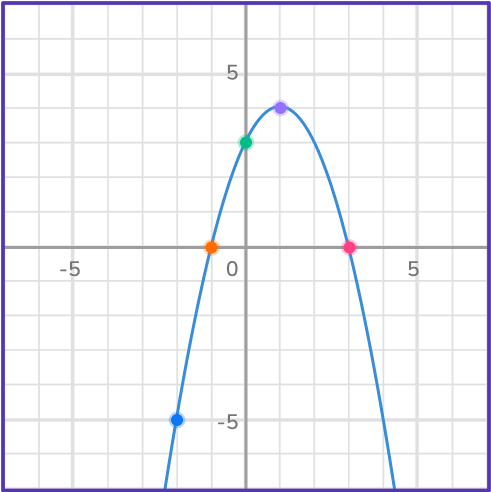
Identify the \textbf{x} -intercepts.
The x -intercepts are (- \, 1, 0) and (3, 0).
State the solution.
The solution to the quadratic equation is x=- \, 1 and x=3.
Example 5:
Determine the solution(s) to the quadratic equation by graphing.
y=(x+4)^2Create a table of values to plot the quadratic equation.
In order to create a table of values, select any values you want for x and substitute them into the equation.
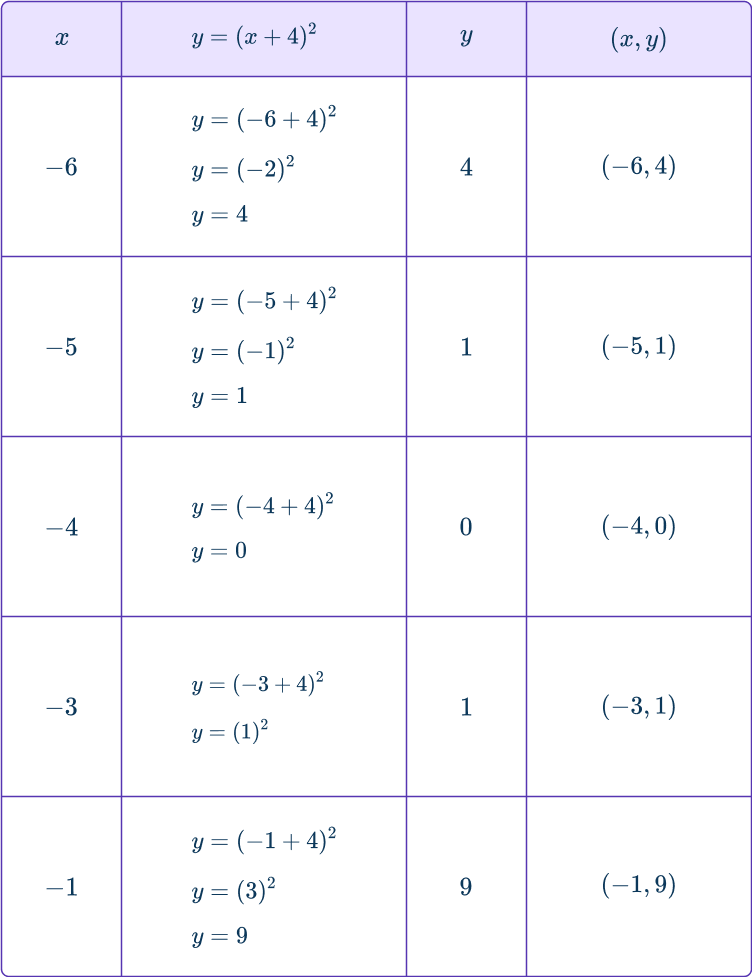
Plot the quadratic equation.
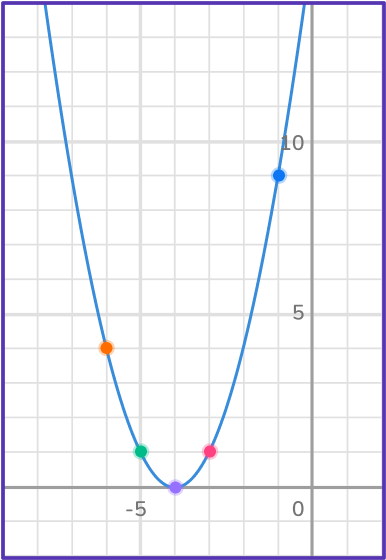
Identify the \textbf{x} -intercepts.
There is only one x -intercept, (- \, 4, 0)
State the solution.
Since there is only one x -intercept, there is only one solution to the quadratic.
x=- \, 4
Example 6:
Determine the solution(s) to the quadratic equation by graphing.
y=(x-1)^2+2Create a table of values to plot the quadratic equation.
In order to create a table of values, select any values you want for x and substitute them into the equation.
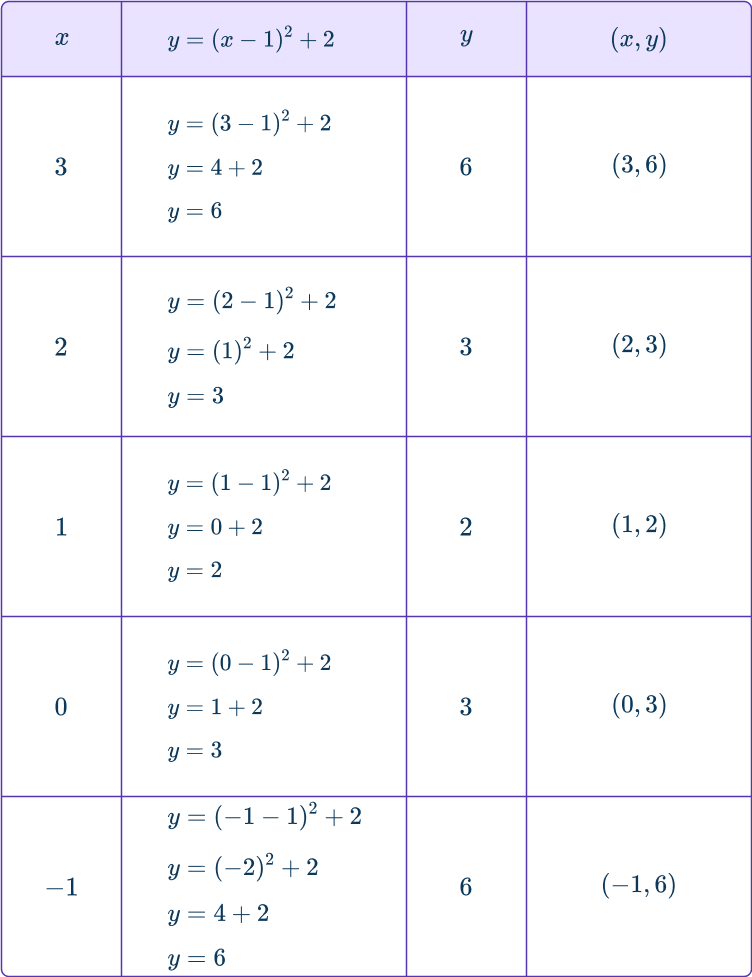
Plot the quadratic equation.
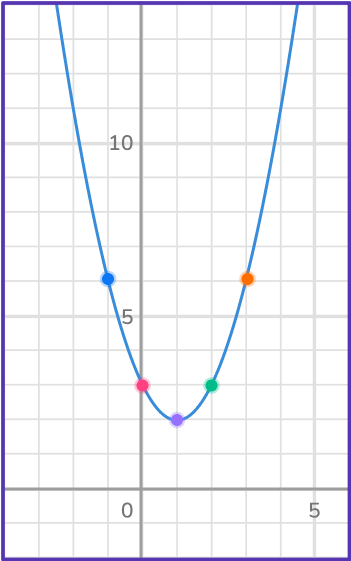
Identify the \textbf{x} -intercepts.
Looking at the graph, the parabola does not cross the x -axis, so there are not any x -intercepts.
State the solution.
Since there are not any x -intercepts, the quadratic does not have any real solutions.
Teaching tips for quadratic graphs
- Incorporate discovery based activities so students can investigate and discover the features of a quadratic graph.
- Use graphing tools such as graphing calculators and online graphing calculators such as Desmos.
- Use online platforms to engage students so that students can practice skills, such as Desmos and Khan Academy.
Easy mistakes to make
- Confusing the \textbf{x} -intercept with the \textbf{y} -intercept
When identifying the x and y intercepts, the x -intercept has a y -coordinate of 0 and the y -intercept has an x -coordinate of 0. However, sometimes students mix this up.
- Making errors when dealing with negative \textbf{x} values, particularly when squaring
For example, (- \, 3)^{2}=9, not - \, 9.
If you’re using your calculator, make sure you include brackets around the x value that you are squaring.
Related quadratic graph lessons
Practice quadratic graphs questions
1. What is the axis of symmetry of the parabola?
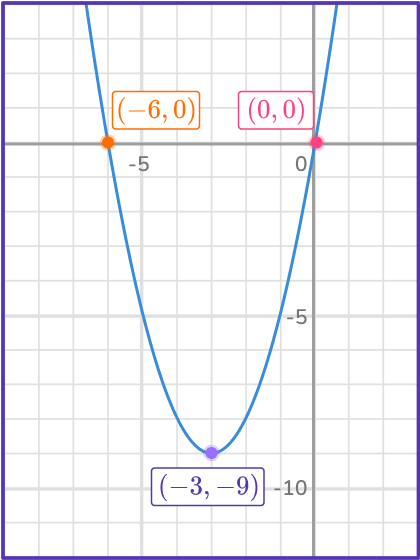


The axis of symmetry is one of the key features of a quadratic equation. It is the vertical line that cuts the parabola in half vertically and always contains the vertex point.
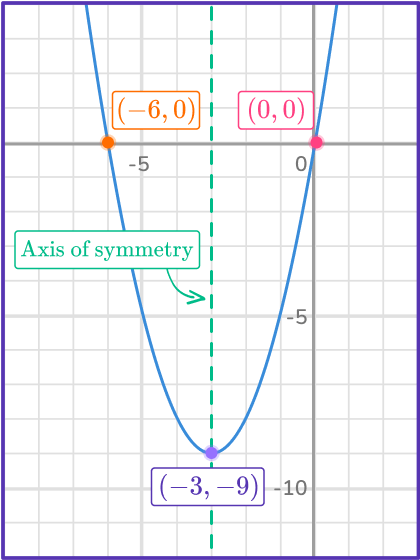
The equation of a vertical line is always, x= some number. For a parabola it is the x value of the vertex point, x=- \, 3.
2. Identify the y-intercept and the x -intercepts.
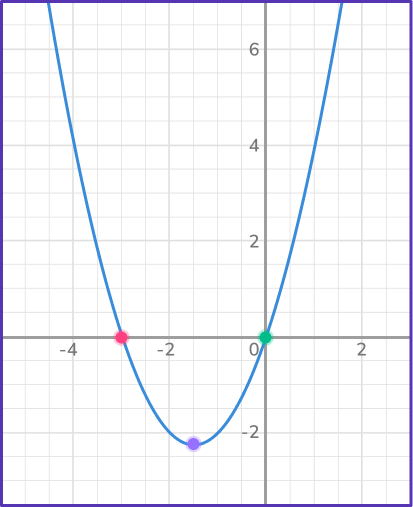
y -intercept (0, 0) and x -intercept (- \, 3,0)

no y -intercept, and x -intercepts (- \, 3,0) & (0,0)

y -intercept (0,0) and x -intercept (0,0)

y -intercept (0,0) and x -intercepts (- \, 3,0) and (0,0)

The y -intercept is the point where the parabola crosses the y -axis and has an x -coordinate of 0. The x -intercepts are the points where the parabola crosses the x -axis and have y -coordinates of 0.
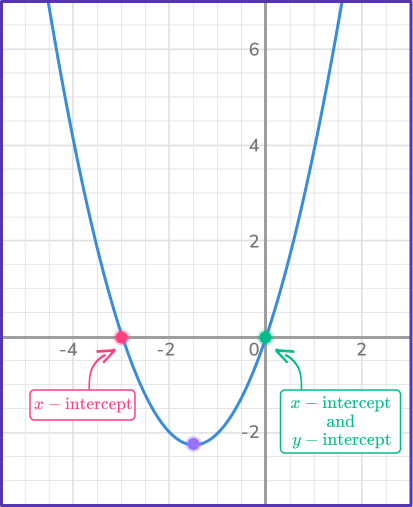
In this case, the y -intercept is at the origin, (0,0). When there is a y -intercept at the origin, there is also an x -intercept at the origin, so in this case one of the x -intercepts is also (0, 0). There is another x -intercept at (- \, 3, 0).
3. If the axis of symmetry of a particular quadratic equation is x=- \, \cfrac{1}{2}, which one of the points can possibly be the vertex point?


The axis of symmetry is a vertical line that goes through the vertex of the parabola.
So, the equation of the axis of symmetry is the same as the x -coordinate of the vertex.
Since the axis of symmetry is x=- \, \cfrac{1}{2} that means that the x -coordinate of the vertex is also – \, \cfrac{1}{2}.
So, \left(- \, \cfrac{1}{2}, 4\right) can be the coordinates of the vertex.
4. Identify the roots of the quadratic equation.
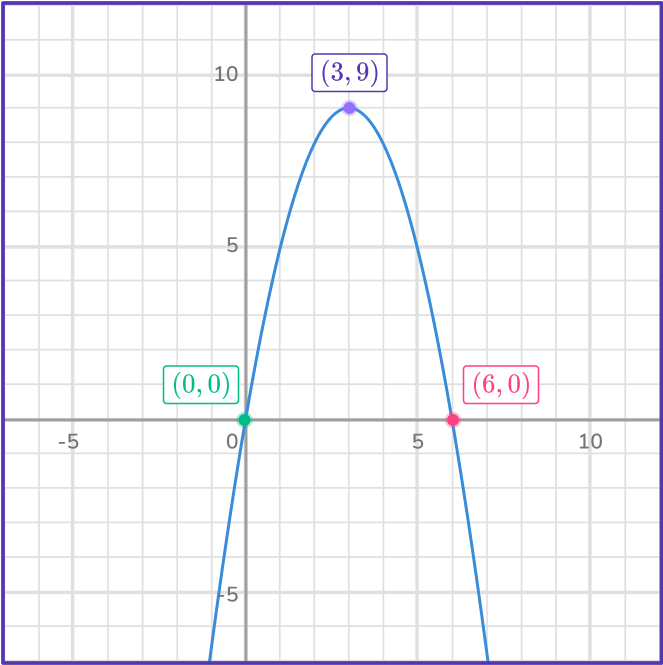
x=3 and x=9

x=0 and x=6

x=6 and x=3

x=3 and x=0

The roots of a quadratic equation are the x -intercepts. In this case, the x -intercepts are at (0,0) and (6,0) so the roots are x=0 and x=6.
5. What is the axis of symmetry of the quadratic function, f(x)=x^2+8 x+15?


There are several strategies you can use to find the axis of symmetry of the quadratic, f(x)=x^2+8 x+15.
One strategy is to make a table of values to graph the quadratic.
Another strategy which is probably more concise is to use the equation, x=\cfrac{- \, b}{2 a}.
In this case, a=1, \, b=8, and c=15, using those values substitute into the equation, x=\cfrac{- \, b}{2 a}.
x=\cfrac{- \, (8)}{2(1)}=\cfrac{- \, 8}{2}=- \, 4
x=- \, 4 is the equation of the axis of symmetry.
6. Find the solution of the quadratic graphed below.
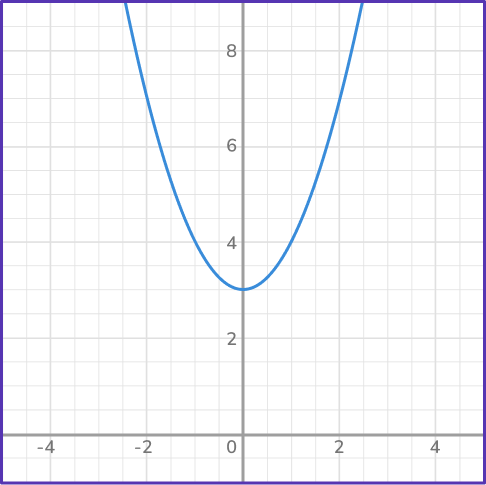

x=3 and x=0


No real solutions

The solutions to a quadratic function are the same as the roots or the x -intercepts. The parabola does not cross the x -axis so there are not any x -intercepts.
Therefore, the quadratic does not have any real solutions, meaning that there are no real numbers that represent the solution of the quadratic.
Quadratic graph FAQs
The vertex form of a quadratic is just another way of expressing a quadratic function. The vertex form is y=a(x-h)^2+k where (h, \, k) represents the vertex of a parabola.
The line of symmetry of a parabola is the axis of symmetry.
Yes, the vertex can be considered the turning point because the parabola turns from being decreasing to increasing at the vertex or from increasing to decreasing at that point.
The next lessons are
Still stuck?
At Third Space Learning, we specialize in helping teachers and school leaders to provide personalized math support for more of their students through high-quality, online one-on-one math tutoring delivered by subject experts.
Each week, our tutors support thousands of students who are at risk of not meeting their grade-level expectations, and help accelerate their progress and boost their confidence.

Find out how we can help your students achieve success with our math tutoring programs.
[FREE] Common Core Practice Tests (3rd to 8th Grade)
Prepare for math tests in your state with these 3rd Grade to 8th Grade practice assessments for Common Core and state equivalents.
Get your 6 multiple choice practice tests with detailed answers to support test prep, created by US math teachers for US math teachers!