High Impact Tutoring Built By Math Experts
Personalized standards-aligned one-on-one math tutoring for schools and districts
In order to access this I need to be confident with:
Graphing linear equations Slope intercept form Quadratic graph Graphing quadratic functionsSolving systems of equations by graphing
Here, you will learn how to solve a system of equations by graphing, including linear and nonlinear systems. You will also learn how to interpret graphs to identify solutions.
Students first learn how to solve systems of equations in the 8 th grade when they learn linear systems. They expand that knowledge as they move through high school math classes.
What is solving systems of equations by graphing?
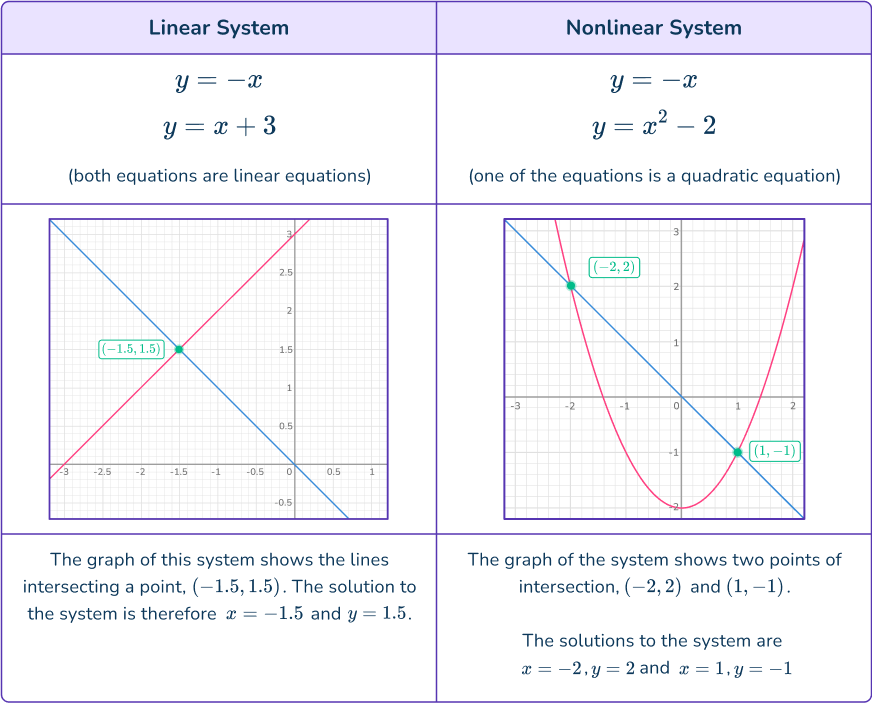
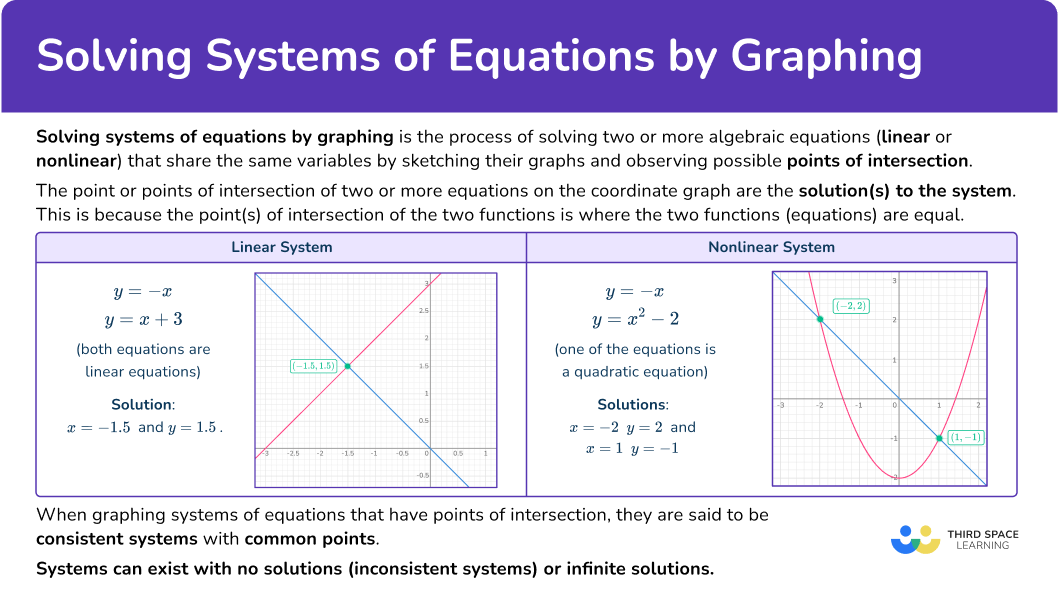
Solving systems of equations by graphing is the process of solving two or more algebraic equations (linear or nonlinear) that share the same variables by sketching their graphs and observing possible points of intersection.
The point or points of intersection of two or more equations on the coordinate graph are the solution(s) to the system. This is because the point(s) of intersection of the two functions is where the two functions (equations) are equal.
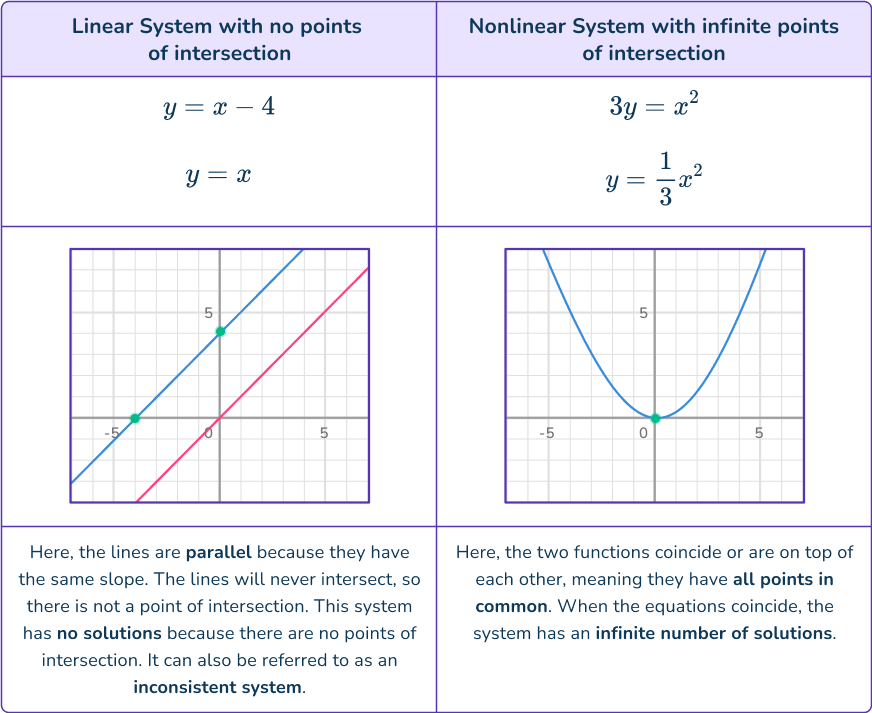
When graphing systems of equations that have points of intersection, they are said to be consistent systems with common points.
Systems can exist with no solutions or infinite solutions.
What is solving systems of equations by graphing?
Common Core State Standards
How does this apply to 8 th grade math and high school math?
- Grade 8 – Expressions and Equations (8.EE.C.8a)
Understand that solutions to a system of two linear equations in two variables correspond to points of intersection of their graphs, because points of intersection satisfy both equations simultaneously.
- High School Algebra – Reasoning with Equations and Inequalities: (HSA-REI.C.6)
Solve systems of linear equations exactly and approximately (example, with graphs), focusing on pairs of linear equations in two variables.
- High School Algebra – Reasoning with Equations and Inequalities: (HSA-REI.C.7)
Solve a simple system consisting of a linear equation and a quadratic equation in two variables algebraically and graphically. For example, find the points of intersection between the line y=- \, 3x and the circle x^2+y^2=3.
![[FREE] Solving Systems Of Equations By Graphing Worksheet (Grade 8 And High School)](https://thirdspacelearning.com/wp-content/uploads/2025/01/Solving-systems-of-equations-by-graphing-worksheet-listing-image.png)
[FREE] Solving Systems Of Equations By Graphing Worksheet (Grade 8 And High School)
Use this worksheet to check your 8th grade and high school students’ understanding of solving systems of equations by graphing. 15 questions with answers to identify areas of strength and support!
DOWNLOAD FREE [FREE] Solving Systems Of Equations By Graphing Worksheet (Grade 8 And High School)
Use this worksheet to check your 8th grade and high school students’ understanding of solving systems of equations by graphing. 15 questions with answers to identify areas of strength and support!
DOWNLOAD FREEHow to solve a system by graphing
In order to solve a system by graphing, you need to:
- Graph both equations on the same set of axes.
- Locate any points of intersection on the graph.
- State the solution(s).
Solving systems of equations by graphing examples
Example 1: solving linear system
Solve the following system by graphing:
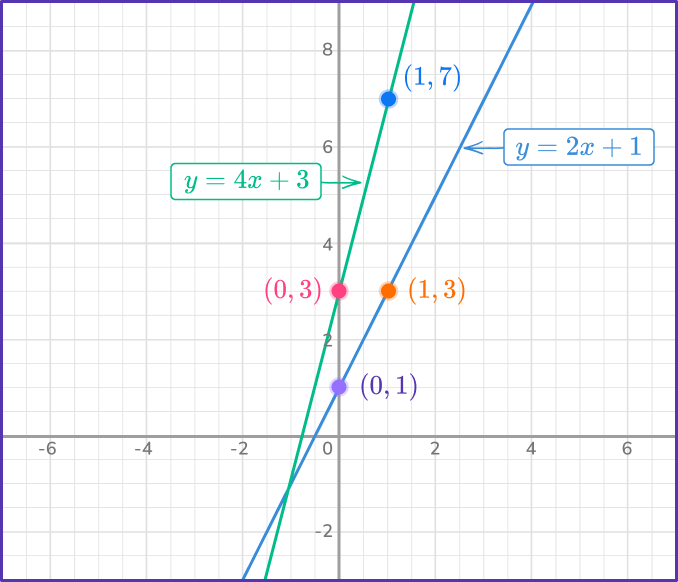
\begin{aligned}y&=2x+1 \\\\ y&=4x+3 \end{aligned}
- Graph both equations on the same set of axes.
Both equations are in slope-intercept form, so they are ready to graph.
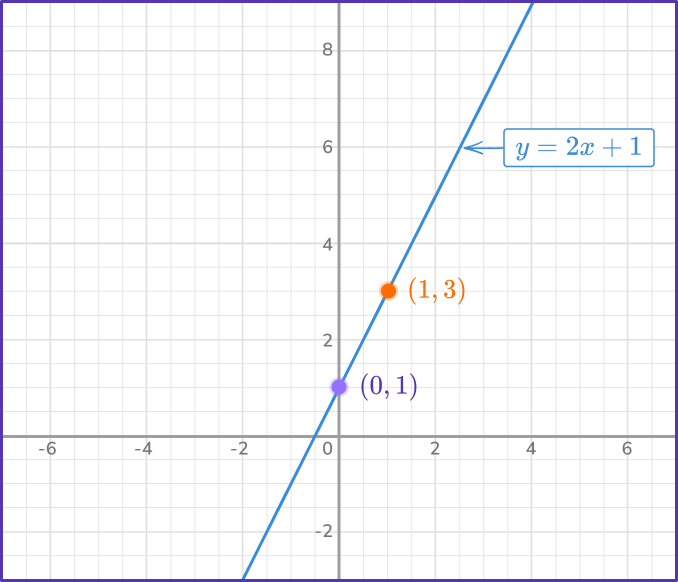
For y=2x+1\text{:}
- The y -intercept b=1 , so plot the point (0, \, 1).
- The slope m=2=\cfrac{2}{1} , so from the y -intercept move 2 units up, and 1 unit right to (1, \, 3).
- Draw a straight line through these two points across the plotting area.
For y=4x+3\text{:}
- The y -intercept b=3 , so plot the point (0, \, 3).
- The slope m=4=\cfrac{4}{1} , so from the y -intercept, move 4 units up and 1 unit right to (1, \, 7).
- Draw a straight line through these two points across the plotting area.
2Locate any points of intersection on the graph.
The two graphs intersect at the point (- \, 1, \, 1).
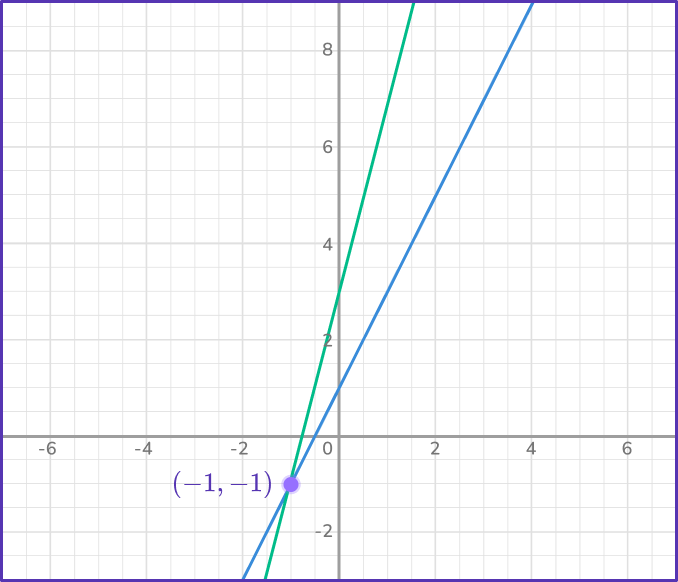
3State the solution(s).
The solution is x=- \, 1 and y=- \, 1.
You can check your solution by substituting x=- \, 1 into each equation and finding y=- \, 1 (or vice versa):
- y=2x+1=2\times(- \, 1)+1=- \, 2+1=- \, 1
- y=4x+3=4\times(- \, 1)+3=- \, 4+3=- \, 1
Example 2: solving nonlinear system
Solve the nonlinear system by graphing.
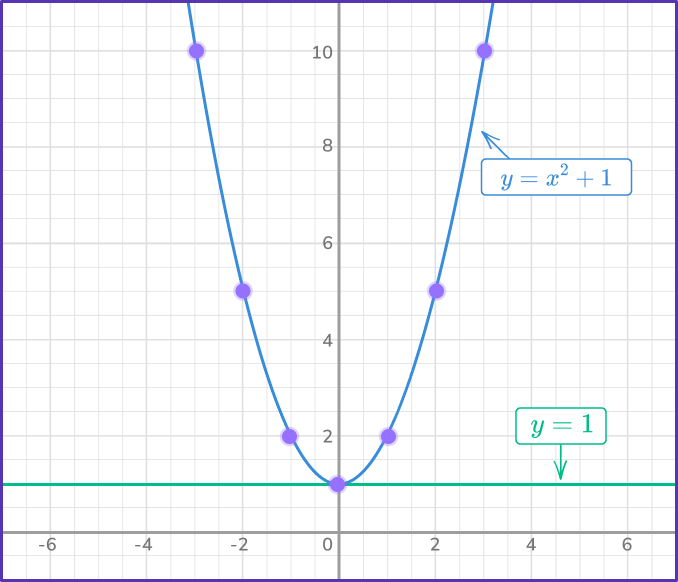
\begin{aligned}y&=x^{2}+1 \\\\ y&=1 \end{aligned}
Calculate a handful of points on the curve y=x^{2}+1 by substituting values of x into the equation to find the corresponding values of y.
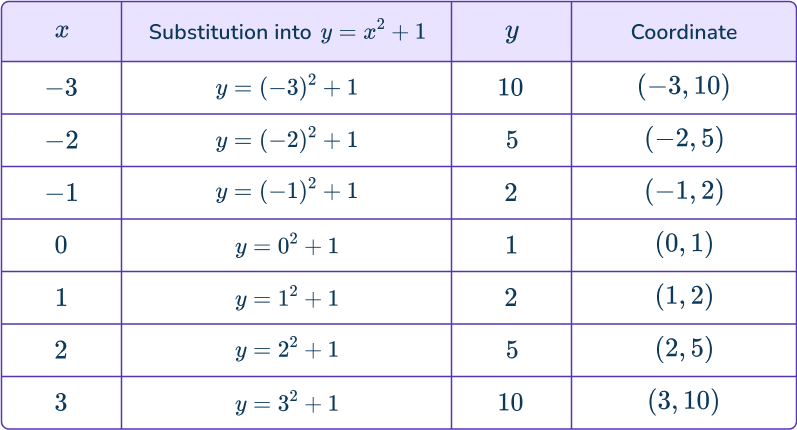
Plot the points and connect using a single smooth curve.
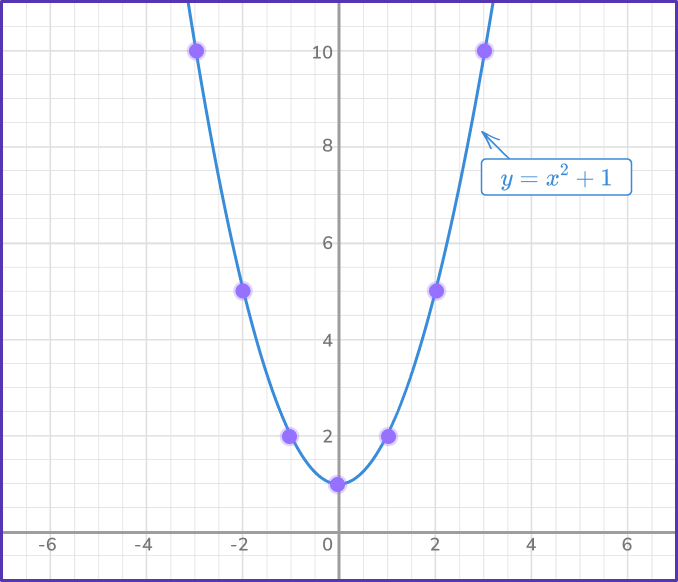
The line y=1 is a horizontal line intersecting the y -axis at (0, \,1) as the values of x are independent to y. For any x -value, y=1 always.
The two graphs intersect at the point (0, \, 1).
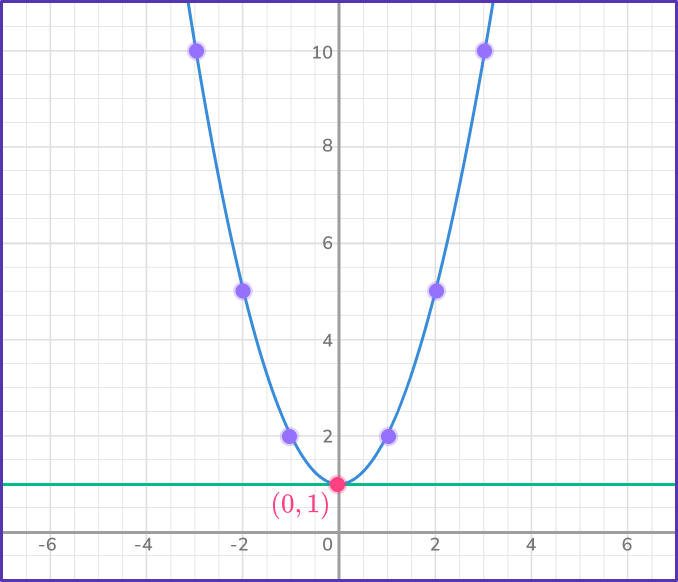
The point of intersection is (0, \, 1) , which means that the solution is x=0 and y=1.
You can verify this by substituting those values in both equations.
y=x^{2}+1=(0)^{2}+1=0+1=1
y=1
Example 3: solving linear system with no solution
Solve this linear system by graphing.
\begin{aligned}4x+2y&=- \, 8 \\\\ 6x+3y&=12 \end{aligned}
You can use several strategies to graph the linear equations.
Let’s use the slope intercept form to graph, rearranging each equation to the form y=mx+b. This is the same as solving each equation for y.
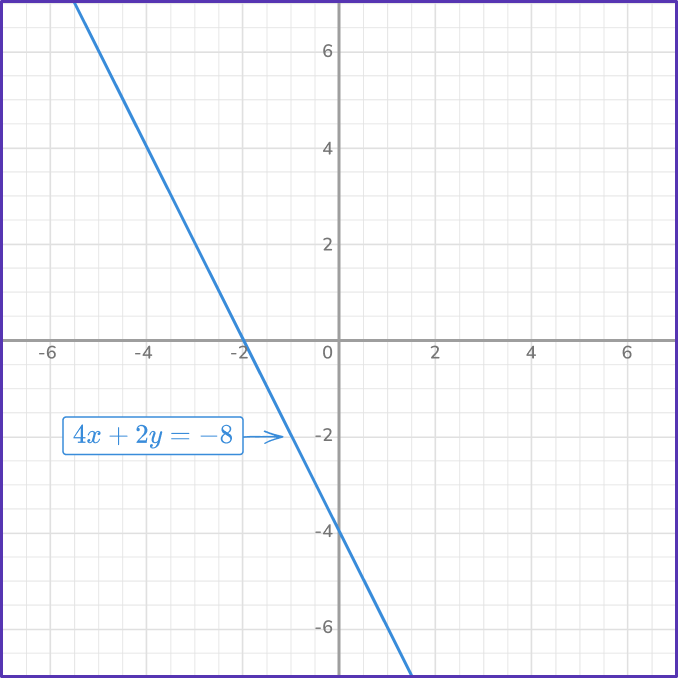
For 4x+2y=- \, 8\text{:}
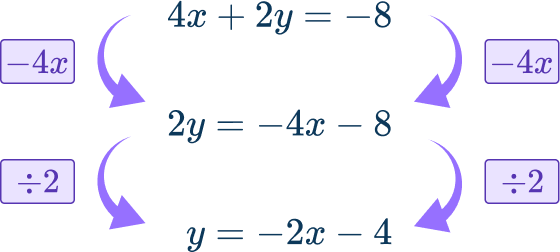
- The y -intercept b=- \, 4 , so plot the point (0, \, - \, 4).
- The slope m=- \, 2=\cfrac{- \, 2}{1} , so from the y -intercept move 2 units down and 1 unit right to (1, \, - \, 6).
- Draw a straight line through these two points across the plotting area.
For 6x+3y=12\text{:}
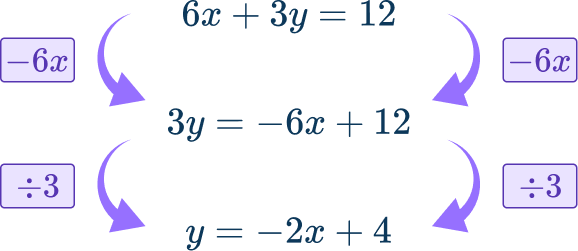
- The y -intercept b=4 , so plot the point (0, \, 4).
- The slope m=- \, 2=\cfrac{- \, 2}{1} , so from the y -intercept move 2 units down and 1 unit right to (1, \, 2).
- Draw a straight line through these two points across the plotting area.
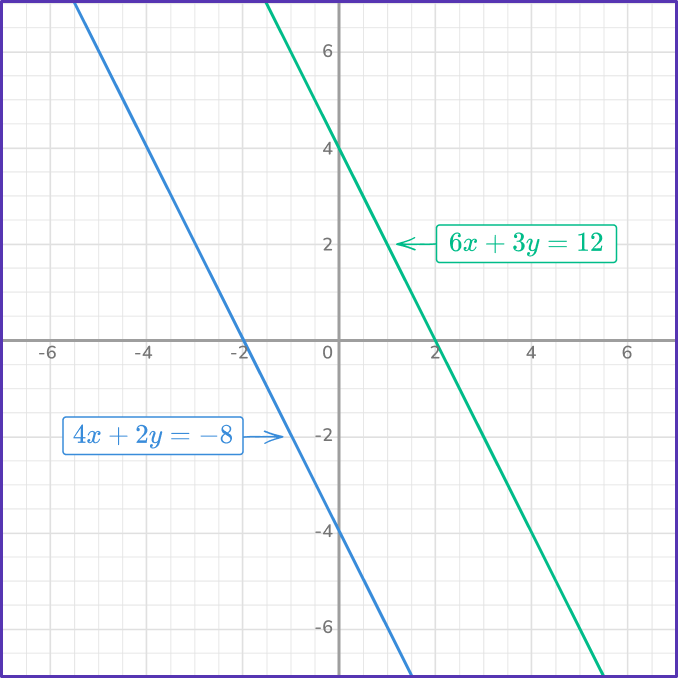
The two graphs have no points of intersection as they are parallel.
There are no solutions to the system.
Example 4: solving nonlinear system with no solution
Solve the nonlinear system by graphing.
\begin{aligned}y&=- \, x^2+1 \\\\ y&=5 \end{aligned}
Calculate a handful of points on the curve y=x^{2}+1 by substituting values of x into the equation to find the corresponding values of y.
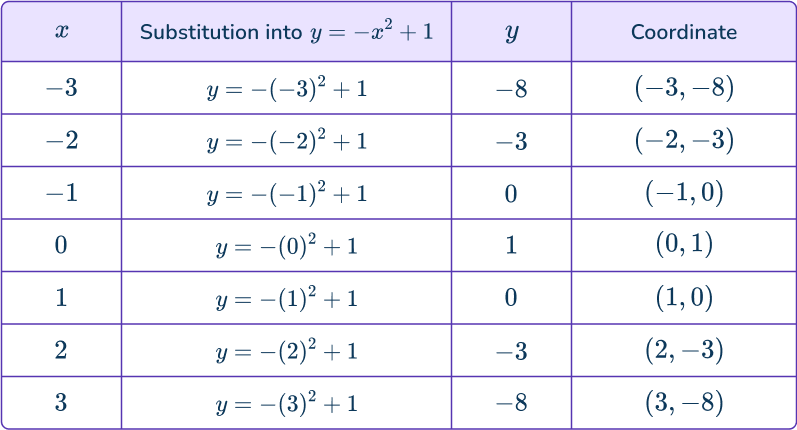
Plot the points and connect using a single smooth curve.
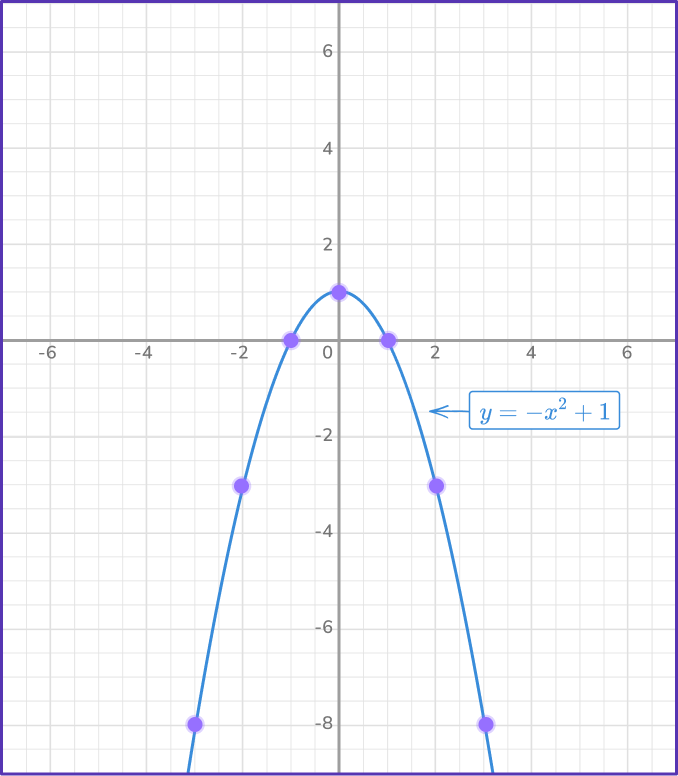
The line y=5 is a horizontal line intersecting the y -axis at (0, \, 5) as the values of x are independent to y. For any x -value, y=5 always.
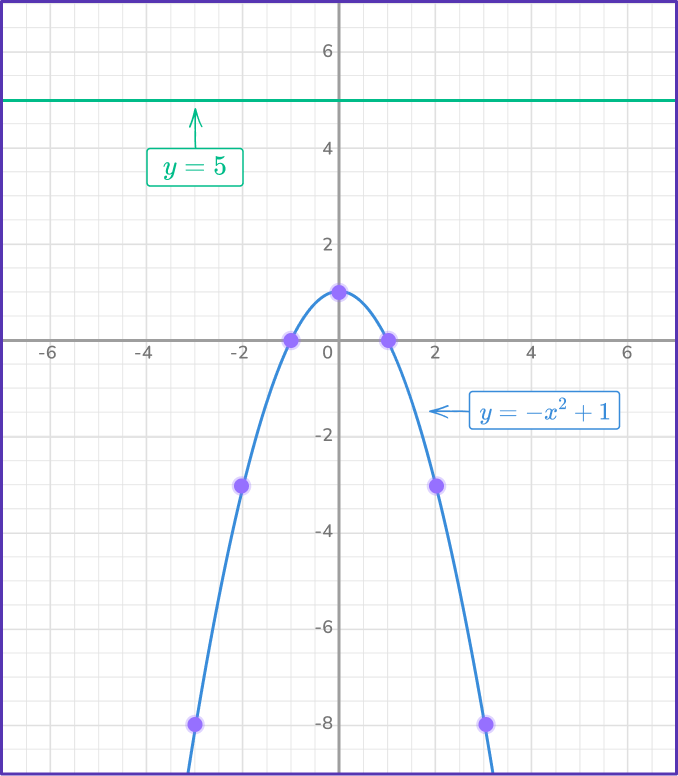
There are no points of intersection as the point (0, \, 1) is the maximum point of the curve (all other points are below this point) and all points on y=5 are above this point.
This system has no solutions.
Example 5: solving nonlinear system with a cubic
Solve the nonlinear system of equations.
\begin{aligned}y&=x^{3} \\\\ y&=x \end{aligned}
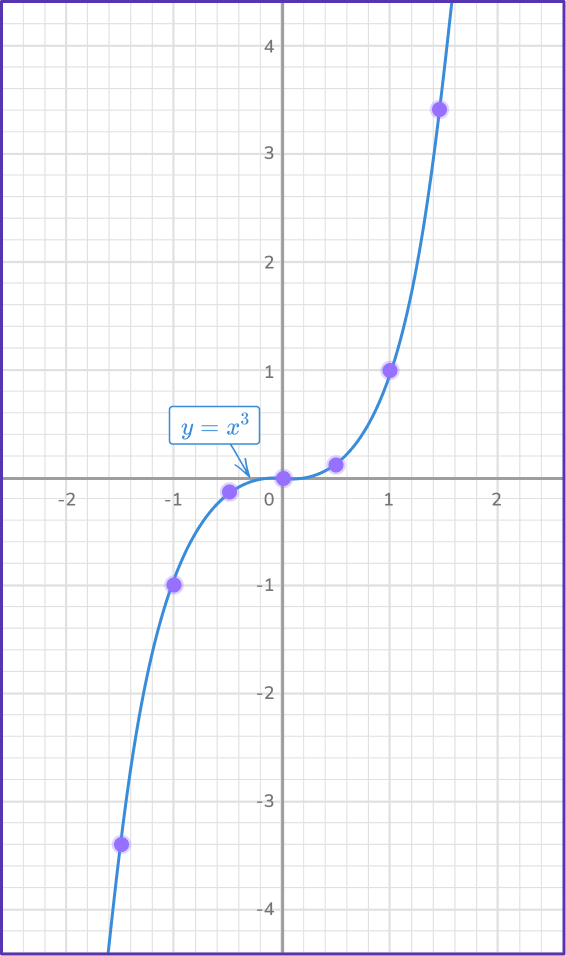
Calculate a handful of points on the curve y=x^{3} by substituting values of x into the equation to find the corresponding values of y.
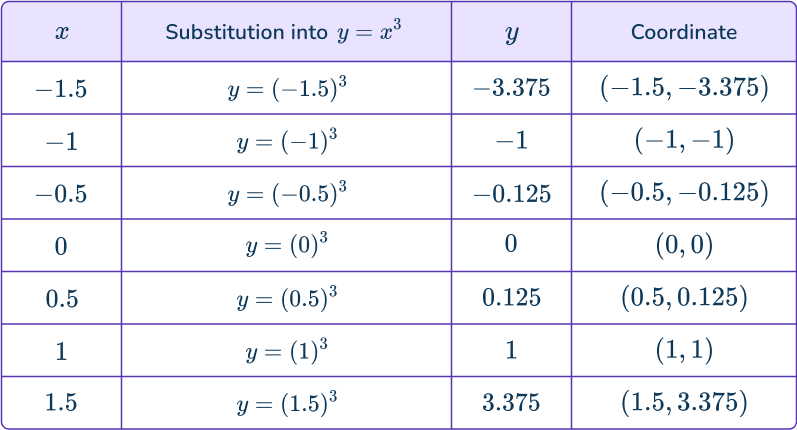
Plot the points and connect using a single smooth curve.
For y=x\text{:}
- The y -intercept b=0 , so plot the point (0, \, 0).
- The slope m=1=\cfrac{1}{1} , so from the y -intercept move 1 unit up and 1 unit right to (1, \, 1).
- Draw a straight line through these two points across the plotting area.
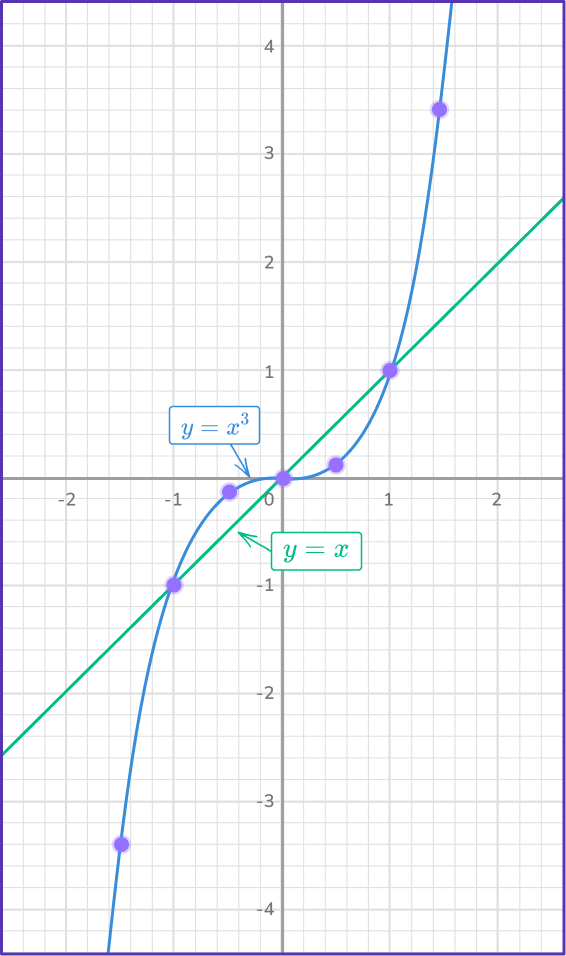
The two graphs intersect at the three points: (- \, 1, \, - \, 1), \, (0, \, 0) and (1, \, 1).
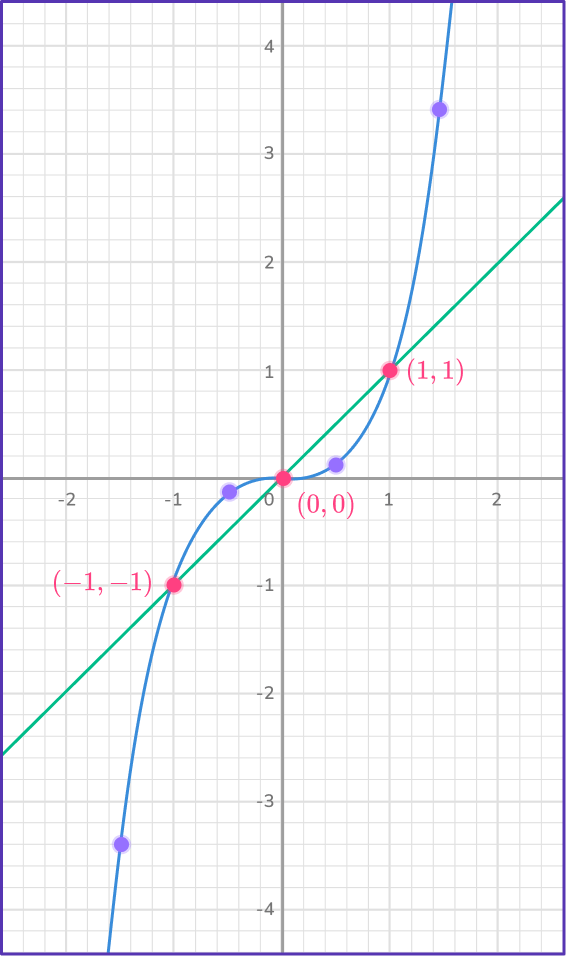
The system has three solutions:
\begin{aligned}x&=- \,1, \, y=- \, 1 \\\\ x&=0, \, y=0 \\\\ x&=1, \, y=1 \end{aligned}
You can verify this by substituting those values in both equations.
When x=- \, 1,~y=x^{3}=(- \, 1)^{3}=- \, 1
When x=0,~y=x^{3}=(0)^{3}=0
When x=1,~y=x^{3}=(1)^{3}=1
When x=- \, 1, \, y=- \, 1.
When x=0, \, y=0.
When x=1, \, y=1.
Example 6: solving nonlinear systems with circle (estimate of solutions)
Find approximate solutions to the nonlinear system by graphing.
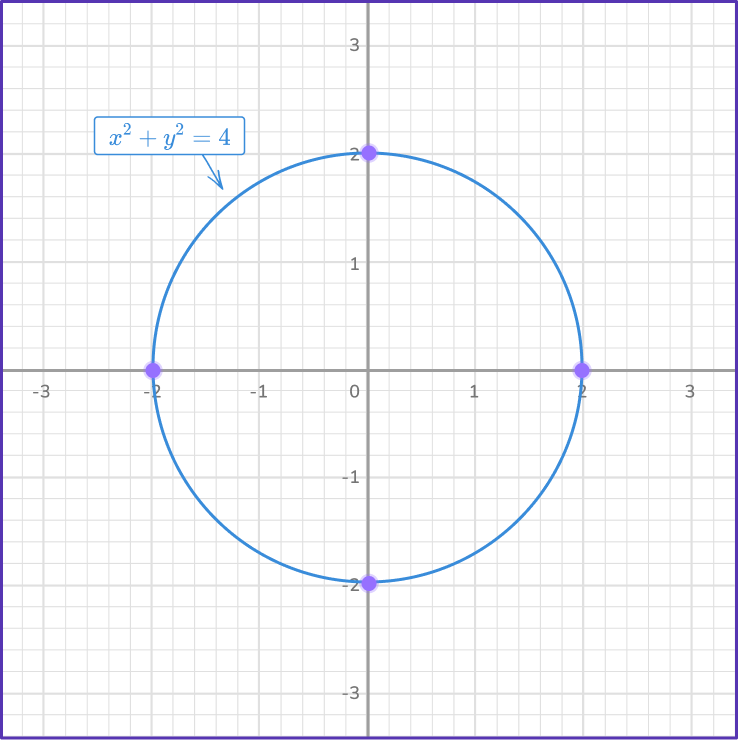
\begin{aligned}x^2+y^2&=4 \\\\ x&=1.2 \end{aligned}
The equation x^2+y^2=4 represents a circle that has its center at (0, \, 0) and its radius is \sqrt{4}=2. The points where the circle intersect each axis are found by substituting x=0 and y=0 into the equation of the circle.
When x=0,
\begin{aligned}0^{2}+y^{2}&=4 \\\\
y^{2}&=4 \\\\
y&=\pm \, \sqrt{4}= \pm \, 2 \end{aligned}
So when x=0, \, y=2 and y=- \, 2 giving the two coordinates (0, \, 2) and (0, \, - \, 2).
When y=0,
\begin{aligned}x^{2}+0^{2}&=4 \\\\
x^{2}&=4 \\\\
x&=\pm \, \sqrt{4}= \pm \, 2 \end{aligned}
So when y=0, \, x=2 and x=- \, 2 giving the two coordinates (2, \, 0) and (- \, 2, \, 0).
Plot all four points onto the set of axes and connect them with a circle centered at (0, \, 0).
The line x=1.2 is a vertical line intersecting the x -axis at (1.2, \, 0) as the values of y are independent to x. For any y -value, x=1.2 always.
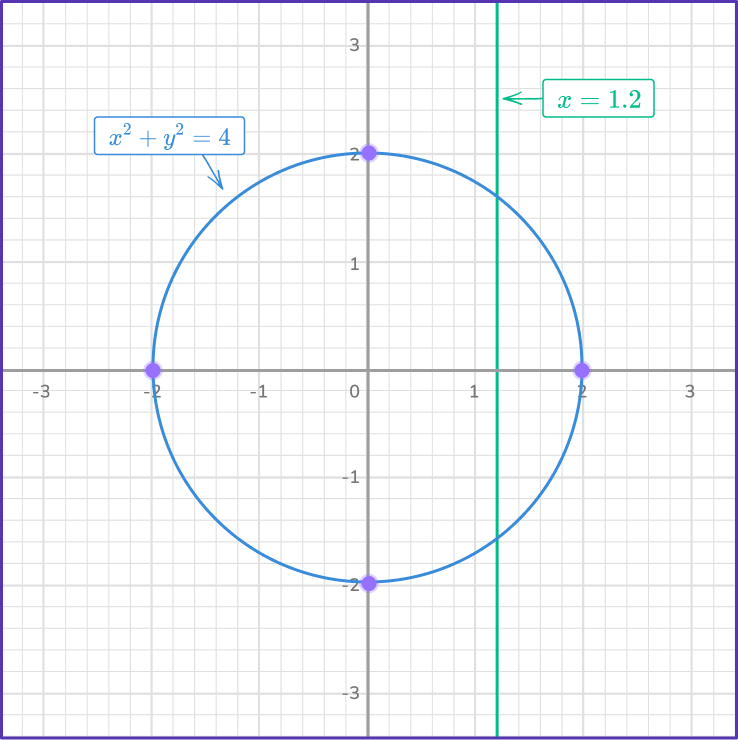
The two equations intersect approximately at the points (1.2, \, 1.6) and (1.2, \, - \, 1.6).
The two approximate solutions are x=1.2, \, y=1.6 and x=1.2, \, y=-1.6.
Teaching tips for solving systems of equations by graphing
- Have students work in collaborative groups using poster paper type graph paper to sketch systems of equations and identify solutions. Have students present their sketches to the class or create a gallery walk.
- Plot graphs using online tools.
- Allow students to use a calculator, emphasizing the use of brackets when substituting a negative number raised to a power.
Easy mistakes to make
- Sketching graphs incorrectly
Although there are several strategies to sketch the various functions, the easiest way to graph them if you do not recall other strategies is to:
- Complete a table of values for each of the equations.
- Try to solve the equations for y (especially for linear functions).
- Select values for x and substitute them into the equations to find the values of y.
- Sketch the points on the coordinate plane and connect the points to form the equations.
- Look for the points of intersection.
- Thinking that a system of linear equations that are not parallel does not have a solution
When sketching lines (or any function), be sure to extend them as long as possible in order to find the point of intersection. Sometimes, if lines are not extended, it might look like they do not intersect.
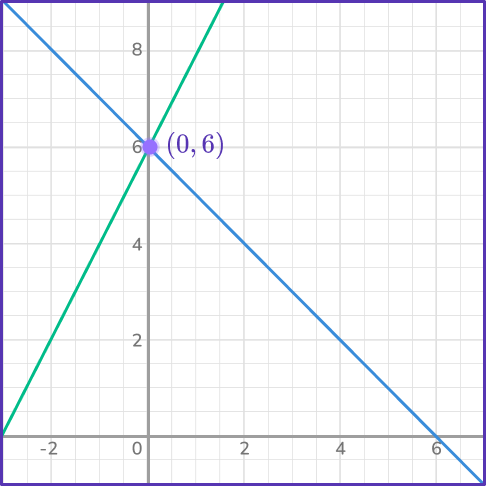
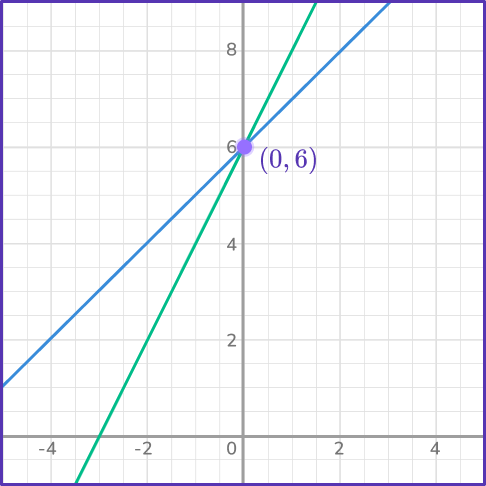
For example, these lines are not parallel, which means they do intersect. Be sure to draw the lines long enough so that you can see the point of intersection.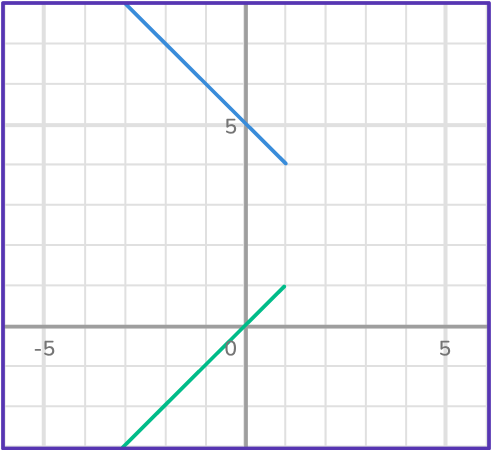
As you can see, extending the lines helps to see the point of intersection.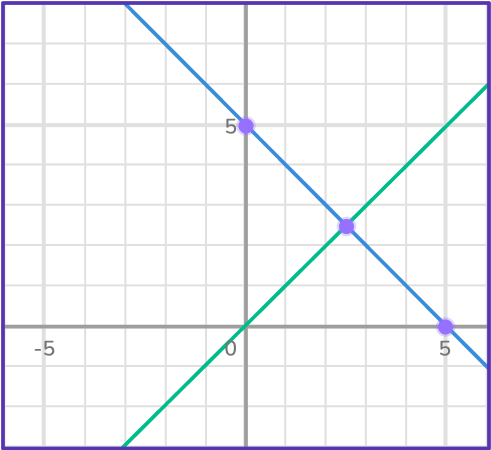
- Thinking there is only \bf{1} point of intersection
Remember linear and quadratic functions can intersect at 0, \, 1 or 2 points. If the lines have multiple points of intersection, make sure they match the correct value of x and y. Lines and circles can intersect at 0, \, 1, or 2 points too.
- Thinking that the most you can have is \bf{2} points of intersection
A system of equations that are circles or circles and parabolas, or any combination of conic sections can produce as many as 4 points of intersection.
For example, in this case of a system that is comprised of a parabola and circle, there are 4 points of intersection.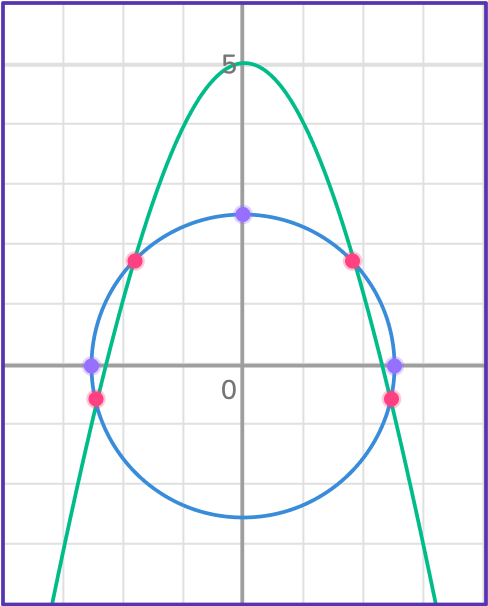
Related systems of equations lessons
Practice solving systems of equations by graphing questions
1. Can two linear equations intersect at two points?
Yes

No

Sometimes
Need more information
Lines can either have 0 points of intersection, coincide or have only 1 point of intersection.
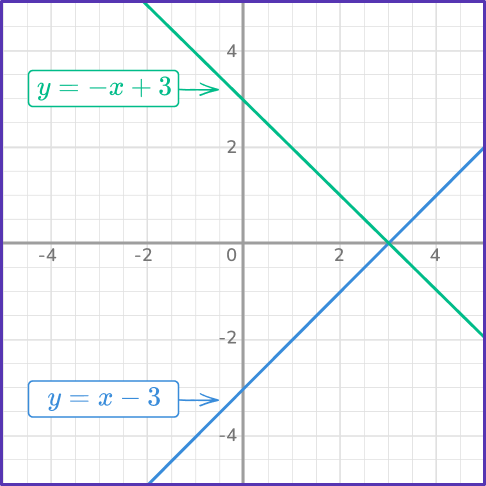
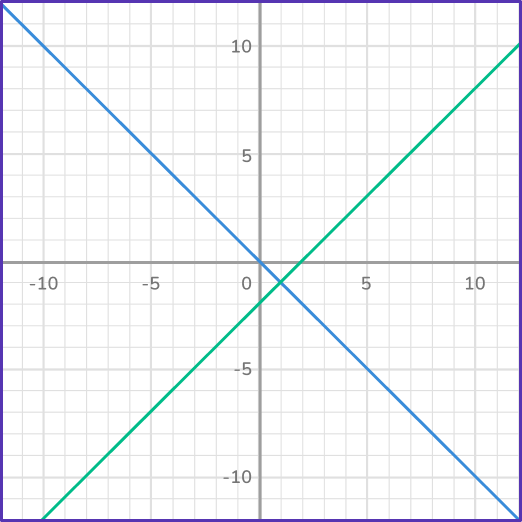
2. Find the solution to the linear system by graphing.
\begin{aligned}&y=- \, x+3 \\\\ &y=x-3 \end{aligned}
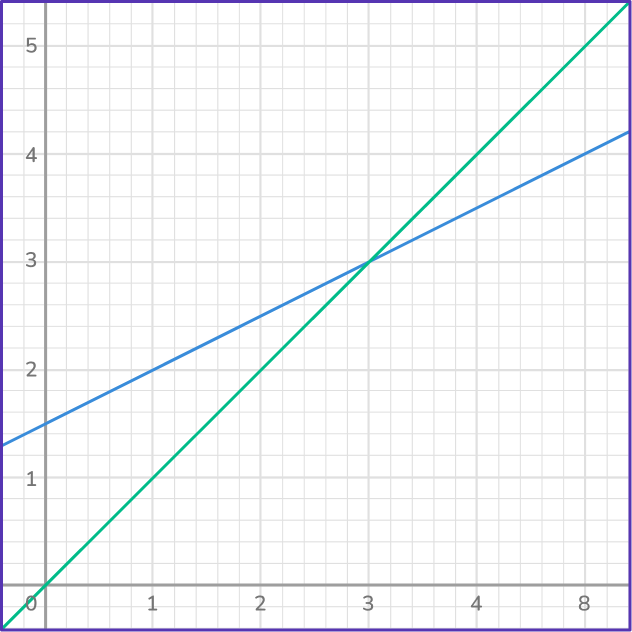
Graph both lines on the coordinate plane using a strategy you are most comfortable applying. Then determine if there is a point of intersection. In this case, there is a point of intersection at (3, \, 0) meaning that the solution to the system is x=3 and y=0.
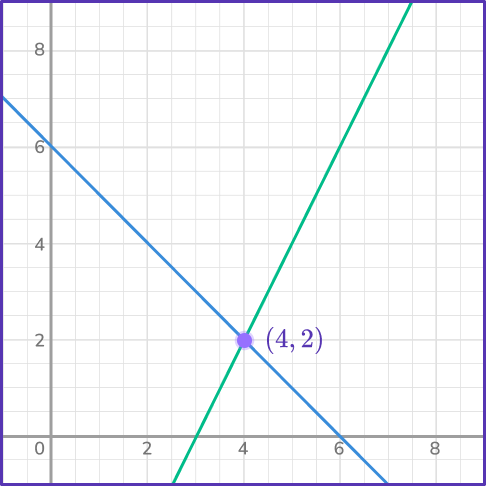
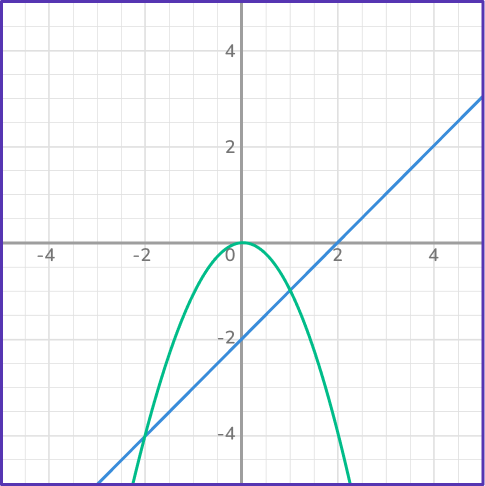
3. Determine which graph represents the solution to the system:
\begin{aligned}&2x-y=6 \\\\ &y=- \, x+6 \end{aligned}
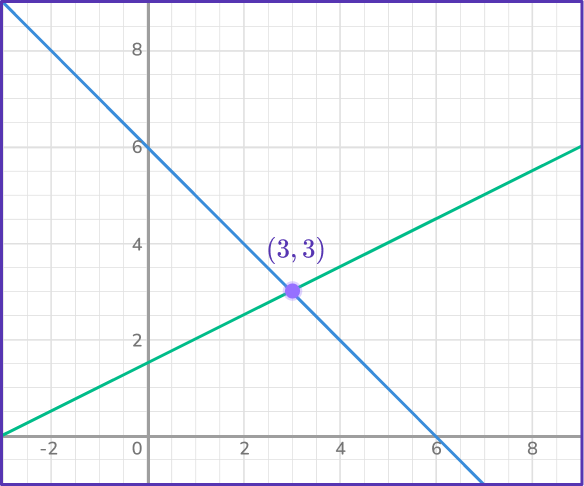
Let’s rearrange each equation to slope intercept form y=mx+b.
2x-y=6
2x=y+6
y=2x-6
y=- \, x+6 is already in slope intercept form.
Graph both lines on the same set of axes and determine if there is a point of intersection. In this case, the lines do intersect at the point (4, \, 2).
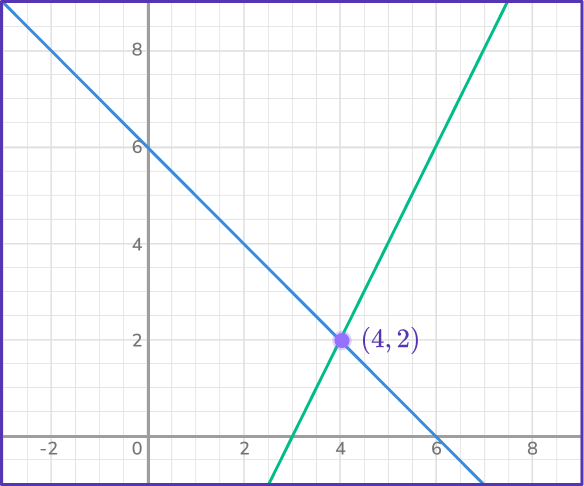
This means the solution to the linear system is x=4 and y=2.
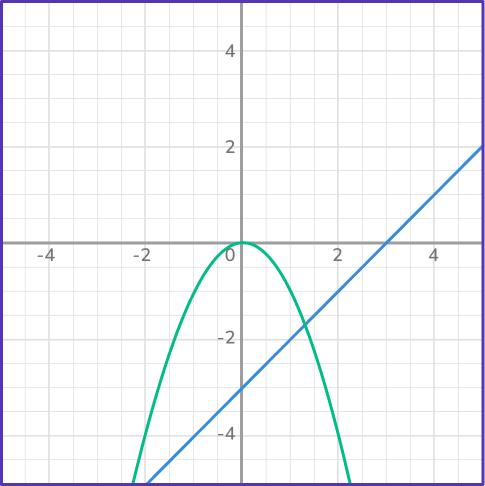
4. Which system has no solutions?
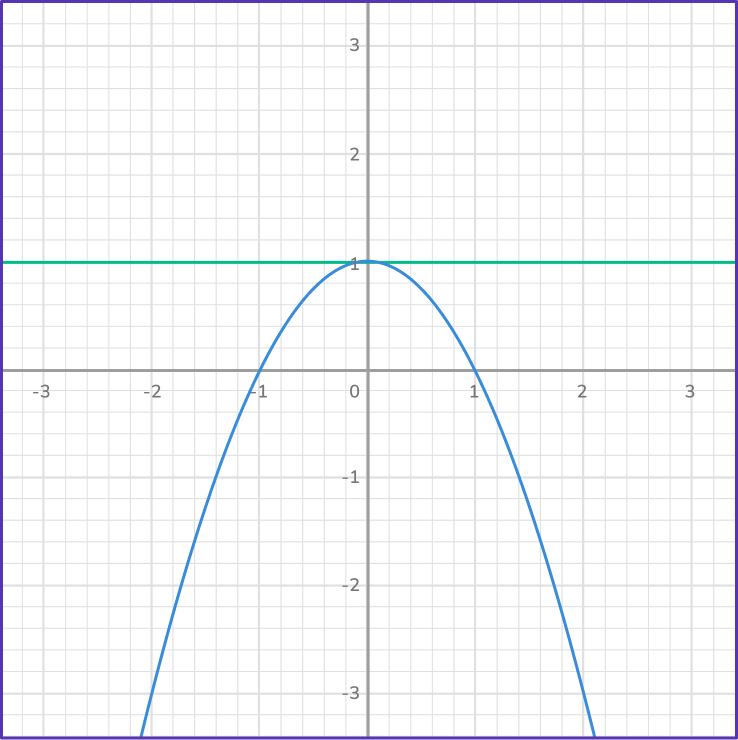

Since the point or points of intersection are the solutions to a system of equations, when equations do not intersect, they will have no solution.
Notice, in this case, how the line and the parabola are never going to intersect.
This system has no solution.
5. Graph the system of equations to determine the solution.
\begin{aligned}4&y-4=16x \\\\ &y=4 x+1 \end{aligned}
infinite solutions
No solution
Use a strategy that you are most comfortable applying to graph the two lines.
In this case, it might be a good idea to rearrange into the form y=mx+b
\begin{aligned}4y-4&=16x \\\\ 4y-4+4&=16x+4 \\\\ 4y&=16x+4 \\\\ 4y\div{4}&=(16x\div{4})+(4\div{4}) \\\\ y&=4x+1 \end{aligned}
Notice that when you solve the equation for y, it’s the same as the other equation. This means that the lines coincide, which means that they are on top of each other. When this happens, the system has infinite solutions because all of the points are common to both lines.
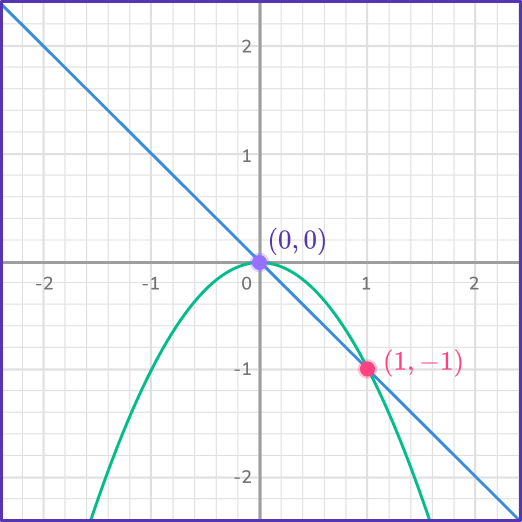
6. Which system of equations has the solutions (0, \, 0) and (1, \, – \, 1)?
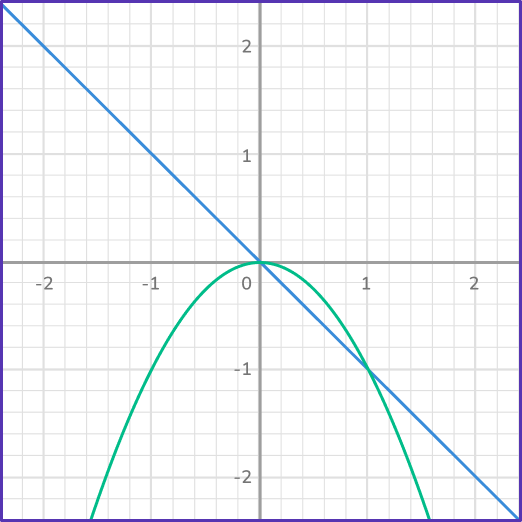
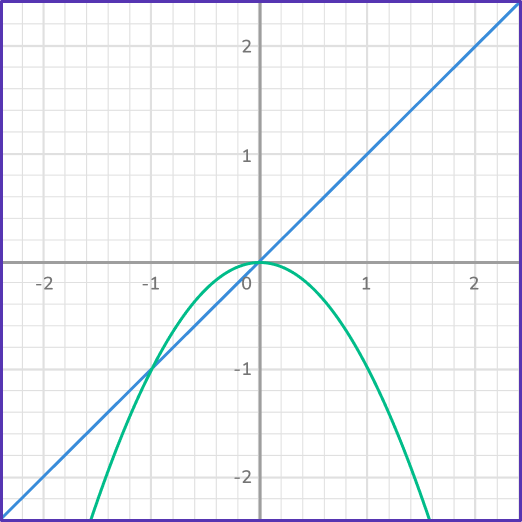
Looking at each of the graphs, first determine which ones have 2 points of intersection. Then correctly identify the coordinates of each of the points of intersection.
In this case, the graph has a linear equation and quadratic equation that intersect at the points (0, \, 0) and (1, \, – \, 1).
Solving systems of equations by graphing FAQs
Yes, the solution to a system of equations can be any real number. However, it’s more difficult to determine the solution by graphing when the answer is a fraction. There are other strategies that can be used if graphing does not give the precise solution.
Yes, graphing is the best way to solve a system of linear inequalities. The overlap shaded area of the coordinate plane represents all the points that are the solution to the system.
You can use the strategy of factoring to graph quadratic equations. Factoring helps to find the x -intercepts of the parabola.
The next lessons are
Still stuck?
At Third Space Learning, we specialize in helping teachers and school leaders to provide personalized math support for more of their students through high-quality, online one-on-one math tutoring delivered by subject experts.
Each week, our tutors support thousands of students who are at risk of not meeting their grade-level expectations, and help accelerate their progress and boost their confidence.

Find out how we can help your students achieve success with our math tutoring programs.
[FREE] Common Core Practice Tests (3rd to 8th Grade)
Prepare for math tests in your state with these 3rd Grade to 8th Grade practice assessments for Common Core and state equivalents.
Get your 6 multiple choice practice tests with detailed answers to support test prep, created by US math teachers for US math teachers!