High Impact Tutoring Built By Math Experts
Personalized standards-aligned one-on-one math tutoring for schools and districts
In order to access this I need to be confident with:
Converting fractions, decimals and percentages Multiplying decimals Multiplying fractions Solving equationsProbability distribution
Here you will learn about probability distribution, including theoretical probability, expected frequency, relative frequency and experimental probability.
Students will first learn about probability distribution as part of statistics and probability in 7 th grade.
What is a probability distribution?
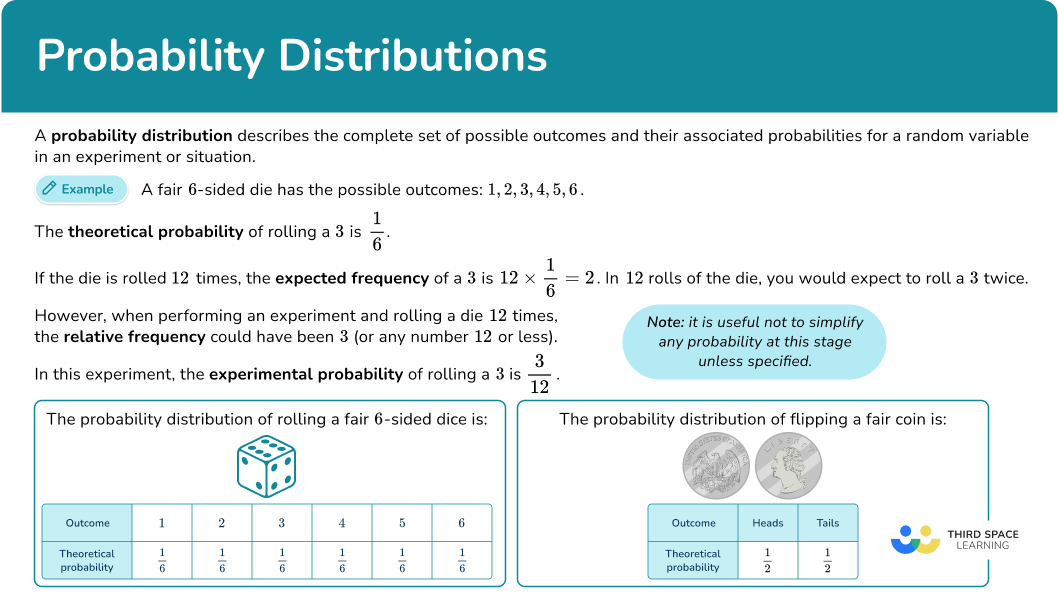
A probability distribution describes the complete set of possible outcomes and their associated probabilities for a random variable in an experiment or situation. Two types of probability are theoretical and experimental.
Theoretical probability calculates the likelihood of an event using mathematical principles and formulas, rather than conducting physical experiments or collecting empirical data.
To do this, use the following formula:
\text{Theoretical probability}=\cfrac{\text{frequency of the event occurring}}{\text{total frequency of possible outcomes}}For example, the theoretical probability of rolling a 3 on a fair 6 -sided die is \cfrac{1}{6}.
Step-by-step guide: Theoretical probability
Experimental probability is the likelihood of an event calculated by conducting repeated trials or observations and measuring the actual outcomes.
To calculate the experimental probability of an event, you calculate the relative frequency of the event.
To do this, use the following formula:
\text{Experimental probability}=\text{Relative frequency}=\cfrac{\text{frequency of the event occurring}}{\text{total number of trials of the experiment}}Step-by-step guide: Experimental probability
Expected frequency represents the predicted number of times an event will occur when an experiment is repeated a specific number of times.
To find the expected frequency, multiply the probability of that event taking place by the number of trials of the experiment, using the following formula:
\text{Expected frequency }=\text{ probability of event }\times\text{ number of trials}For example, if a fair 6 -sided die is rolled 12 times, the expected frequency of a 3 is 12\times\cfrac{1}{6}=2.
In 12 rolls of the die, you would expect to roll a 3 twice.
Step-by-step guide: Expected frequency
![[FREE] Probability Worksheet (Grade 7 to 12)](https://thirdspacelearning.com/wp-content/uploads/2023/07/Probability-check-for-understanding-quiz-listing-image.png)
[FREE] Probability Worksheet (Grade 7 to 12)
![[FREE] Probability Worksheet (Grade 7 to 12)](https://thirdspacelearning.com/wp-content/uploads/2023/07/Probability-check-for-understanding-quiz-listing-image.png)
Use this quiz to check your grade 7 to 12 students’ understanding of probability distribution. 15+ questions with answers covering a range of probability topics to identify areas of strength and support!
DOWNLOAD FREE![[FREE] Probability Worksheet (Grade 7 to 12)](https://thirdspacelearning.com/wp-content/uploads/2023/07/Probability-check-for-understanding-quiz-listing-image.png)
[FREE] Probability Worksheet (Grade 7 to 12)
![[FREE] Probability Worksheet (Grade 7 to 12)](https://thirdspacelearning.com/wp-content/uploads/2023/07/Probability-check-for-understanding-quiz-listing-image.png)
Use this quiz to check your grade 7 to 12 students’ understanding of probability distribution. 15+ questions with answers covering a range of probability topics to identify areas of strength and support!
DOWNLOAD FREERelative frequency is the number of times an event happens divided by the total number of outcomes that took place in an experiment, known as the total number of trials or the total number of observations. A frequency, or frequency count, is the number of times a value of the data happens.
To calculate the relative frequency, you can use the formula
\text{Relative frequency}=\cfrac{\text{Frequency of the event occurring}}{\text{Total number of trials of the experiment}}For example, when performing an experiment and rolling a 6 -sided die 12 times, the relative frequency could have been 3 (or any number 12 or less).
Step-by-step guide: Relative frequency
Below are some common theoretical probability distributions.
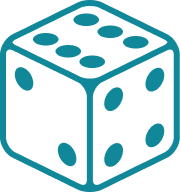
The probability distribution of rolling a fair 6 -sided die is:

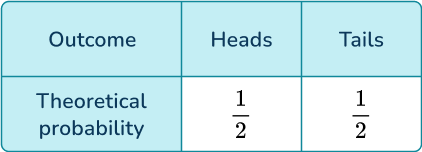
The probability distribution of flipping a fair coin is:

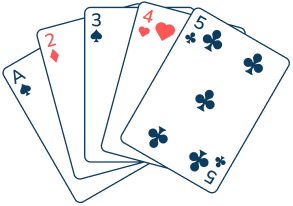
The probability distribution of picking a card from a deck is:

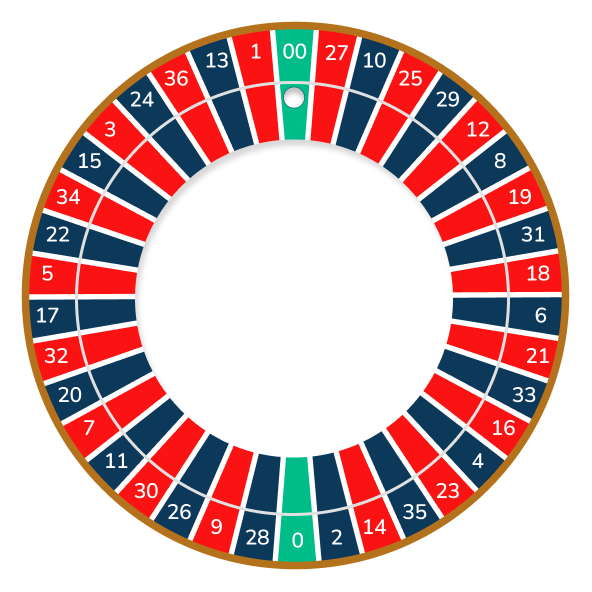
The probability distribution of spinning a color on a roulette wheel is:

What is a probability distribution?
Common Core State Standards
How does this relate to 7 th grade math?
- Grade 7 – Statistics and Probability (7.SP.C.5)
Understand that the probability of a chance event is a number between 0 and 1 that expresses the likelihood of the event occurring. Larger numbers indicate greater likelihood. A probability near 0 indicates an unlikely event, a probability around \cfrac{1}{2} indicates an event that is neither unlikely nor likely, and a probability near 1 indicates a likely event.
- Grade 7 – Statistics and Probability (7.SP.C.7)
Develop a probability model and use it to find probabilities of events. Compare probabilities from a model to observed frequencies; if the agreement is not good, explain possible sources of the discrepancy.
- Grade 7 – Statistics and Probability (7.SP.C.8)
Find probabilities of compound events using organized lists, tables, tree diagrams, and simulation.
How to use probability distribution
There are a lot of ways to use probability distribution. For more specific step-by-step guides, check out the probability pages linked in the “What is a probability distribution?” section above or read through the examples below.
Probability distribution examples
Example 1: selecting a random letter
Lettered cards spell out the word mathematics.

The cards are mixed up and one is selected at random.
What is the probability that the card selected is a consonant? Display it on the probability scale.
- Determine all possible outcomes.
There are 11 cards altogether in the word MATHEMATICS.
2Determine the frequency of the event occurring.
The set of consonants are all letters except: A, \, E, \, I, \, O, and U. There are 7 consonant cards in the word MATHEMATICS.

3Substitute these values into the formula. Write your answer as a fraction, decimal or percentage.
The frequency of the event occurring is 7 and the total frequency of possible outcomes is 11, the theoretical probability is
P(\text{Consonant})=\cfrac{7}{11}.
Example 2: finding experimental probability relative frequency
A 3 -sided spinner numbered 1, \, 2, and 3 is spun and the results are recorded.
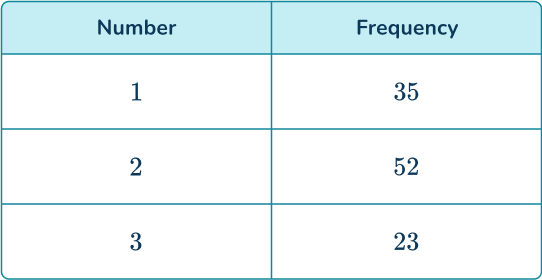
Find the probability distribution for the 3 -sided spinner from these experimental results.
Draw a table showing the frequency of each outcome in the experiment.
A table of results has already been provided. You can add an extra column for the relative frequencies.
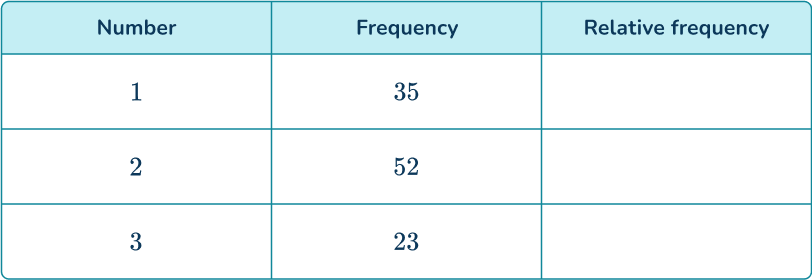
Determine the total number of trials.
Write the experimental probability (relative frequency) of the required outcome(s).
Divide each frequency by 110 to find the relative frequencies.

Example 3: calculating relative frequency or a discrete random variable
A coin lands on heads 18 times, having been flipped 40 times. Calculate the relative frequency of the coin toss showing tails.
Find the number of times the event occurs.
Remember that a coin has two outcomes: heads or tails. If the coin lands on heads 18 times, it would have landed on tails 22 times as 40-18=22.
Find the number of trials of the experiment.
The coin was flipped 40 times.
Use the relative frequency formula and write your answer as a fraction, decimal or percentage.
Example 4: calculating the number of trials if relative frequency is known
An experiment rolling a fair 6 -sided dice landed on the number 4 on 35 occasions.
The relative frequency of rolling a 4 was calculated as 0.14. Find the number of times the dice was rolled.
Find the number of times the event occurs.
The number 4 was rolled 35 times.
Find the number of trials of the experiment.
This is what will need to be calculated using step 3. Represent this value using the letter x.
Use the relative frequency formula and write your answer as a fraction, decimal or percentage.
As the relative frequency is given, substitute this and the frequency of rolling a 4 into the formula.
\text{ Relative frequency }=\cfrac{\text { Frequency of the event occurring }}{\text { Total number of trials of the experiment }}
\begin{aligned} 0.14&=\cfrac{35}{x} \\\\ 0.14x&=35 \\\\ x&=35\div{0.14}=250 \end{aligned}
The number of times the dice was rolled was 250.
Example 5: calculating expected frequency
The probability that John will win a game of tennis is 0.75. If John plays 80 games of tennis, how many can he expect to win?
Determine the total number of trials of the experiment.
The number of trials is 80.
Determine the probability of the event.
The probability of John winning is 0.75.
Multiply the probability of the event by the number of trials of the experiment.
John can expect to win 60 games.
Example 6: exponentially small number of successes
There are 26 letters in the English alphabet. A statistician randomly chooses 3 letters. The probability that the letters ‘pmf’ or ‘cdf’ are chosen is 0.000128. If the statistician does 5,000 trials, how many times can she expect to choose ‘pmf’ or ‘cdf’?
Determine the total number of trials of the experiment.
The number of trials is 5,000.
Determine the probability of the event.
The probability that the letters ‘pmf’ or ‘cdf’ are chosen is 0.000128.
Multiply the probability of the event by the number of trials of the experiment.
The statistician can expect to choose the letters ‘pmf’ or ‘cdf’, \, 0.64 times (or less than 1 time – so it is likely these combinations will not appear at all in 5,000 trials.)
Teaching tips for probability distribution
- When introducing this topic, start with the probability of an event (preferably independent events) that has a small number of total possible values and a small number of occurrences, so that students can spend their time understanding probability, instead of calculating.
- To extend students’ knowledge, apply this topic to real world data science topics, including large sample sizes or having students interpret a probability dataset shown in a histogram.
Easy mistakes to make
- Assuming that all probability distributions are the same
It is possible for students to assume that all the probabilities in a distribution will be the same. Encourage students to focus on only the theorems they are taught, but also be clear that as they continue to learn about probability, they will learn about new distributions.
- Not knowing the meaning of the words “and“ and “or” in probability questions
It is important that students understand the difference between “and” and “or” and when they need to multiply probabilities and when they should add probabilities. Typically, the word “or” means to add the probabilities. “And” will involve multiplication.
- Confusing parameters and statistics
Remind students that parameters describe the population and they are fixed. While statistics describe a sample of the population and therefore can vary.
Practice probability distribution questions
1. Lettered cards spell out the word FRACTION.
![]()
The cards are mixed up and placed into a bag, where one is selected at random. Determine the probability of drawing a consonant.


![]()
There are 5 consonants and 8 total lettered cards in total.
Write the probability as the fraction
\begin{aligned}& P(\text { Consonant })=\cfrac{\text { frequency of the event occurring }}{\text { total frequency of possible outcomes }} \\\\ & P(\text { Consonant })=\cfrac{5}{8} \end{aligned}
2. A 6 -sided die is rolled 200 times and the results are recorded.
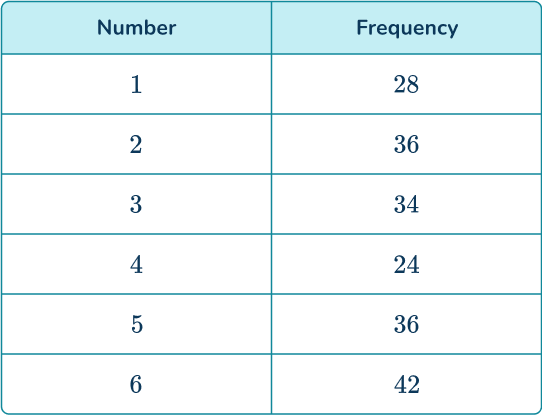
What is the relative frequency of rolling a 6?


There were 200 die rolls in total and 42 of those rolls were 6s.
\begin{aligned}& \text { Relative frequency }=\cfrac{\text { frequency of the event occurring }}{\text { total number of trials of the experiment }} \\\\ & \text { Relative frequency }=\cfrac{42}{200}=\frac{21}{100} \end{aligned}
3. A coin is flipped 85 times and lands on heads 45 times. Find the relative frequency for the coin landing on heads. Give your answer as a fraction in its simplest form.


\begin{aligned} &=\cfrac{45}{85} \\\\ &=\cfrac{45 \div 5}{85 \div 5} \\\\ &=\cfrac{9}{17} \end{aligned}
4. A normal 6 -sided dice is rolled x times. A 2 was rolled 60 times. The relative frequency of the die landing on 2 was 0.16. What is the value of x?


\begin{aligned} 0.16&=\cfrac{60}{x} \\\\ 0.16x&=60 \\\\ x&=60\div{0.16} \\\\ x&=375 \end{aligned}
5. Tyrone sows 180 seeds. The probability of a seed growing is 0.8. Estimate the number of seeds that grow.


6. The probability of a biased die landing on the number 2 is 23 \%. If the die is rolled 4,000 times, find an estimate for the number of times it will land on a 2.


\text { Expected frequency } =0.23 \times 4,000=920
Probability distribution FAQs
The mean.
A measure variation; of how far data points are from the mean.
A distribution that shows the likelihood of different outcomes for a discrete variable. A discrete distribution cannot represent continuous variables.
A discrete probability distribution that describes outcomes with only two possible results in an experiment: success or failure.
There are many in statistics. Some common probability distributions are the normal distribution (Gaussian distribution), Poisson distribution, uniform distribution, Bernoulli distribution, continuous probability distribution, chi-squared distribution and the beta distribution.
The graph of a normal distribution is in the shape of a bell curve, where data points cluster around the middle, with less and less as you move towards both extremes.
The next lessons are
Still stuck?
At Third Space Learning, we specialize in helping teachers and school leaders to provide personalized math support for more of their students through high-quality, online one-on-one math tutoring delivered by subject experts.
Each week, our tutors support thousands of students who are at risk of not meeting their grade-level expectations, and help accelerate their progress and boost their confidence.

Find out how we can help your students achieve success with our math tutoring programs.
[FREE] Common Core Practice Tests (3rd to 8th Grade)
Prepare for math tests in your state with these 3rd Grade to 8th Grade practice assessments for Common Core and state equivalents.
Get your 6 multiple choice practice tests with detailed answers to support test prep, created by US math teachers for US math teachers!