High Impact Tutoring Built By Math Experts
Personalized standards-aligned one-on-one math tutoring for schools and districts
In order to access this I need to be confident with:
Addition and subtraction Multiplication and divisionInput/output tables
Here you will learn about input/output tables, including what input/output tables are, how to generate a number pattern using input/output tables, and how to use input/output tables to plot coordinates on a coordinate plane.
Students will first learn about input/output tables as a part of operations and algebraic thinking in 4 th grade and will expand on their learning in 5 th grade and into middle school.
Every week, we teach lessons on input/output tables to students in schools and districts across the US as part of our online one-on-one math tutoring programs. On this page we’ve broken down everything we’ve learnt about teaching this topic effectively.
What are input/output tables?
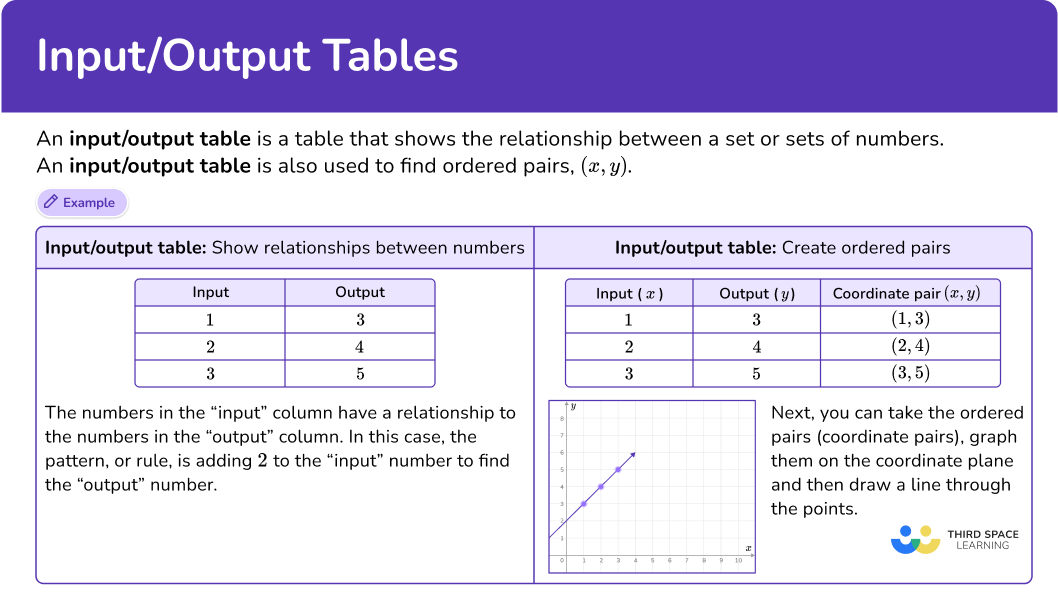
An input/output table is a table that shows the relationship between a set or sets of numbers. An input/output table will show you pairs of numbers that all follow the same rule. Input/output tables can contain integers (whole numbers), fractions, decimals, and negative numbers.
For example,
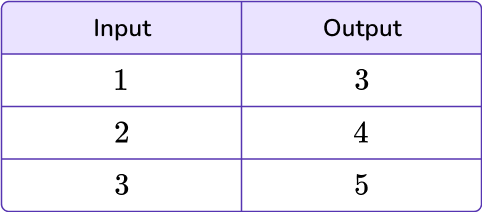
If you look at the relationship between the numbers in the table, they all follow the same number pattern, or rule, of adding 2. You put a number “in,” apply the rule, and then the output comes “out.”
Sometimes various terms within the input/output table are missing, and you will have to determine what the rule is to find the missing numbers.
Let’s look at the table below.
There are two missing outputs that need to be solved for.
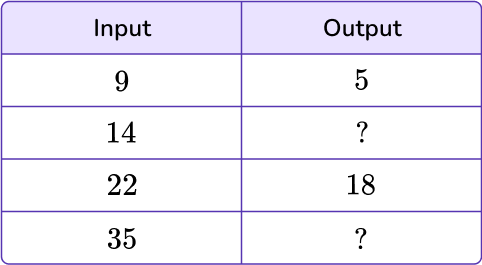
Use the relationship between 9 and 5 and 22 and 18 to help find the missing values.
To find the relationship between the two numbers, determine the pattern.
\begin{aligned} & 9-5=4 \\\\ & 22-18=4 \end{aligned}The rule is to subtract 4. Use that rule to find the missing values in the table.
\begin{aligned} & 14-4=10 \\\\ & 35-4=31 \end{aligned}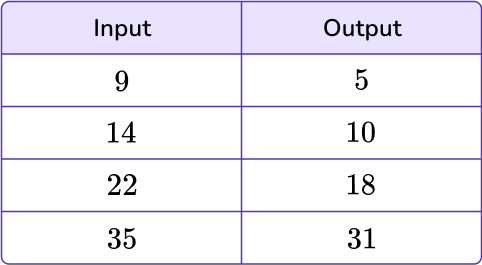
![[FREE] Input/Output Tables Worksheet (Grade 4 and 5)](https://thirdspacelearning.com/wp-content/uploads/2024/04/Input-or-Output-Tables-Worksheet-listing-image.png)
[FREE] Input/Output Tables Worksheet (Grade 4 and 5)
![[FREE] Input/Output Tables Worksheet (Grade 4 and 5)](https://thirdspacelearning.com/wp-content/uploads/2024/04/Input-or-Output-Tables-Worksheet-listing-image.png)
Use this worksheet to check your 4th and 5th grade students’ understanding of input/output tables. 15 questions with answers to identify areas of strength and support!
DOWNLOAD FREE![[FREE] Input/Output Tables Worksheet (Grade 4 and 5)](https://thirdspacelearning.com/wp-content/uploads/2024/04/Input-or-Output-Tables-Worksheet-listing-image.png)
[FREE] Input/Output Tables Worksheet (Grade 4 and 5)
![[FREE] Input/Output Tables Worksheet (Grade 4 and 5)](https://thirdspacelearning.com/wp-content/uploads/2024/04/Input-or-Output-Tables-Worksheet-listing-image.png)
Use this worksheet to check your 4th and 5th grade students’ understanding of input/output tables. 15 questions with answers to identify areas of strength and support!
DOWNLOAD FREEInput/output tables and coordinate planes
Input/output tables can also be used to create ordered pairs from the corresponding terms in each pattern and graph them on the coordinate plane.
An ordered pair (x, y), is a pair of numbers used to locate a point on a coordinate plane.
The first number tells how far to move horizontally on the x -axis and the second number tells how far to move vertically on the y -axis.
For example,
Let’s use the input/output table from above.
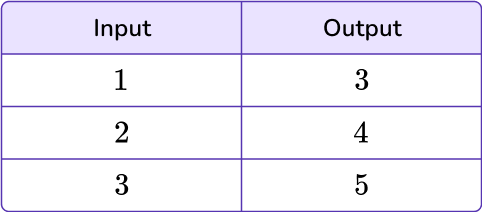
The input is the x value and the output is the y value. This can be used to create coordinate pairs.

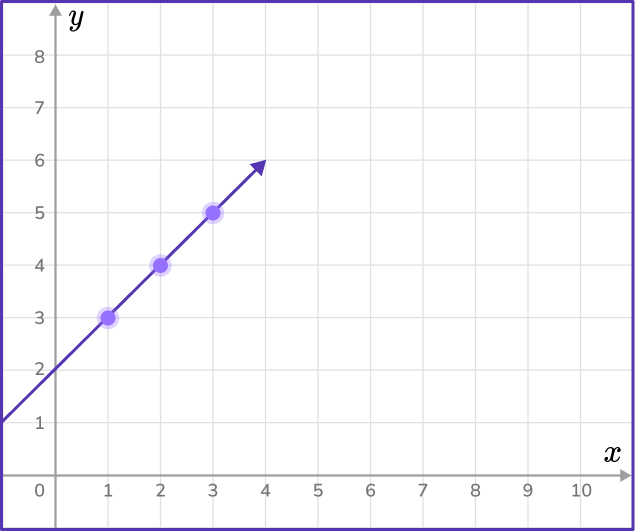
Next, you can graph each set of ordered pairs on the coordinate plane as a point. Then draw a line from the origin to connect the points.
What are input/output tables?
Common Core State Standards
How does this relate to 4 th grade math and 5 th grade math?
- Grade 4: Operations and Algebraic Thinking (4.OA.C.5)
Generate a number or shape pattern that follows a given rule. Identify apparent features of the pattern that were not explicit in the rule itself.
For example, given the rule “ Add 3” and the starting number 1, generate terms in the resulting sequence and observe that the terms appear to alternate between odd and even numbers. Explain informally why the numbers will continue to alternate in this way.
- Grade 4: Measurement and Data (4.MD.A.1)
Know relative sizes of measurement units within one system of units including km, \, m, \, cm; \, kg, \, g; \, lb, \, oz.; \, l, \, ml; \, hr, \, min, sec. Within a single system of measurement, express measurements in a larger unit in terms of a smaller unit. Record measurement equivalents in a two column table.
For example, know that 1~{ft} is 12 times as long as 1~{in}. Express the length of a 4~{ft} snake as 48~{in}. Generate a conversion table for feet and inches listing the number pairs (1, 12), (2, 24), (3, 36).
- Grade 5: Operations and Algebraic Thinking (5.OA.B.3)
Generate two numerical patterns using two given rules. Identify apparent relationships between corresponding terms. Form ordered pairs consisting of corresponding terms from the two patterns, and graph the ordered pairs on a coordinate plane.
For example, given the rule “ Add 3” and the starting number 0, and given the rule “ Add 6” and the starting number 0, generate terms in the resulting sequences, and observe that the terms in one sequence are twice the corresponding terms in the other sequence. Explain informally why this is so.
How to find the missing values in an input/output table
In order to find the missing values in an input/output table:
- Identify the number pattern and state the rule.
- Using the rule, find the missing values in the table.
Input/output tables examples
Example 1: missing values in an input/output table
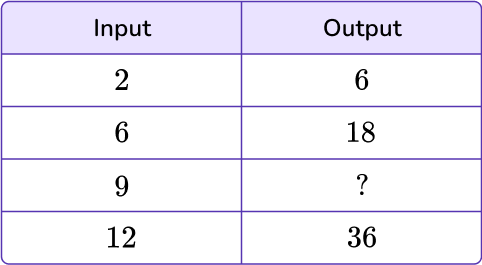
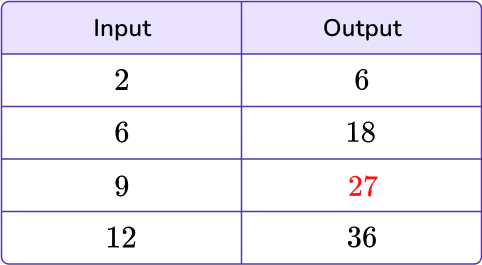
Find the missing values in the given input/output table.
- Identify the number pattern and state the rule.
To identify the pattern, analyze the given values within the table. The input value, 2, turns into the output value, 6, which means either adding 4 or multiplying by 3. In order for it to be a rule, it must be true of all values within the table.
Let’s look at the second input value, 6, and apply both possible rules: adding 4 and multiplying by 3.
6+4=10 and 6 \times 3=18
Multiplying by 3 holds the rule true.
Now try the final given input 12.
12+4=16 and 12 \times 3=36
Again, multiplying by 3 holds the rule true.
The rule for this input/output table is to multiply by 3.
2Using the rule, find the missing values in the table.
You can now find the missing value by using the rule: multiplying by 3.
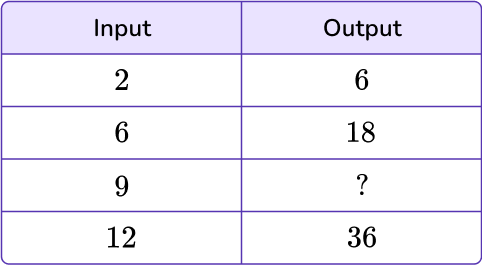
The missing value is 27. You can now fill in the missing value.
Example 2: missing values in an input/output table
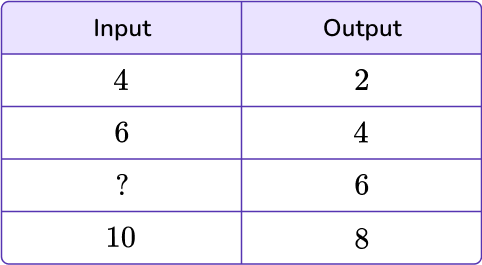
Find the missing values in the given input/output table.
Identify the number pattern and state the rule.
To identify the pattern, analyze the given values within the table. The input value, 4, turns into the output value, 2, which means either subtracting 2 or dividing by 2. In order for it to be a rule, it must be true of all values within the table.
Let’s look at the second input value, 6, and apply both possible rules: subtracting 2 or dividing by 2.
6-2=4 and 6 \div 2=3
Subtracting 2 holds the rule true.
Now try the final given input 10.
10-2=8 and 10 \div 2=5
Again, subtracting 2 holds the rule true.
The rule of this input/output table is subtracting by 2.
Using the rule, find the missing values in the table.
You can now find the missing value by using the rule: subtracting 2.
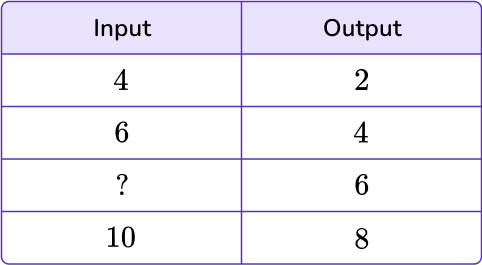
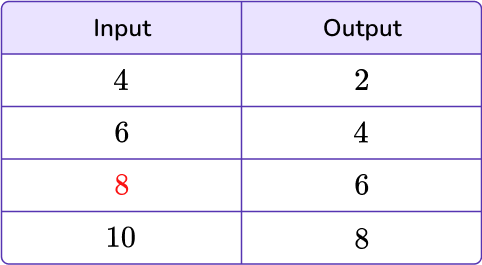
With this input/output table, you are given the output and are looking to find the missing input.
The missing value is 8. You can now fill in the missing value.
Example 3: missing values in an input/output table word problem
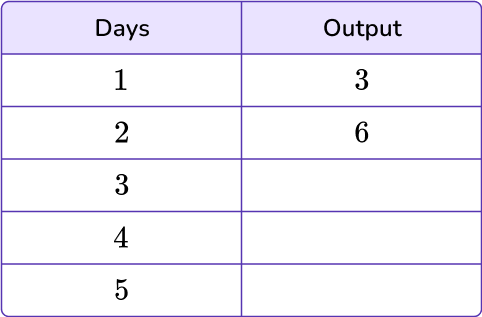
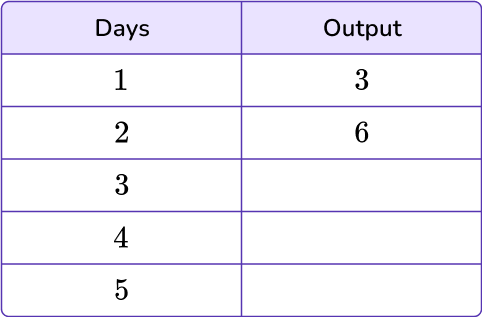
Miss Grace’s 3 rd grade classes stretch for 3 minutes before math class. For 5 days, they continued this practice. How many minutes do they spend stretching during that time? Use the given input/output table to help solve.
Identify the number pattern and state the rule.
To identify the pattern, analyze the given values within the table. The input 1 turns into the output 3, which means either adding 2 or multiplying by 3. In order for it to be a rule, it must be true of all values within the table.
Let’s look at the second input value, 2, and apply both possible rules: adding 2 or multiplying by 3.
2+2=4 and 2 \times 3=6
Multiplying by 3 holds the rule true.
The rule for this input/output table is multiplying by 3.
Using the rule, find the missing values in the table.
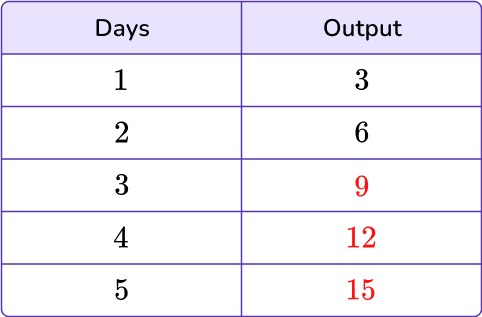
You can now find the missing value by using the rule: multiplying by 3.
The missing values are 9, 12, and 15. You can now fill in the missing values.
How to plot points on a coordinate plane using input/output tables
In order to find the missing values in an input/output table:
- Use pairs of corresponding terms to create an ordered pair.
- Graph each set of ordered pairs on the coordinate plane.
- Draw a line from the origin to connect the points.
Example 4: plot points on a coordinate plane using input/output tables
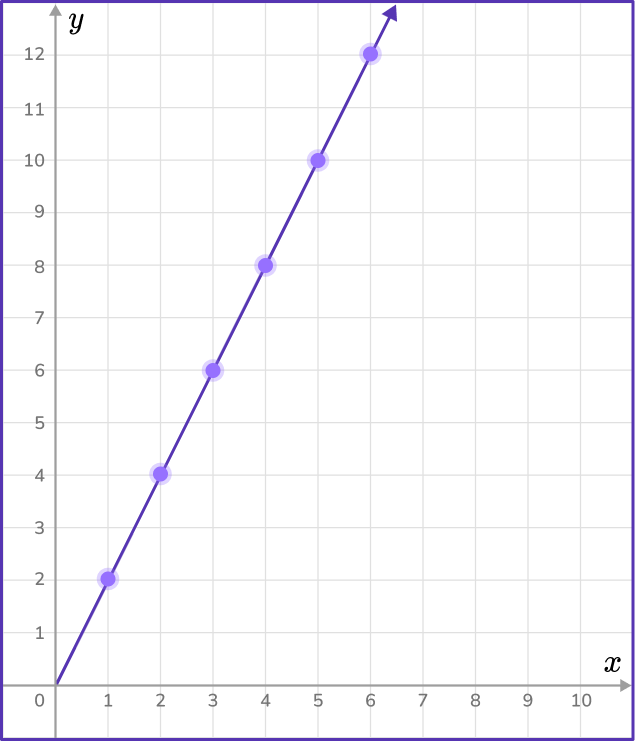
The table below represents the number of sodas that Sammy drank for the last 6 weeks. Graph the data on the coordinate plane.

Use pairs of corresponding terms to create an ordered pair.
The data in the week column will represent the variable x, and the data in the miles column will represent the y variable.

Graph each set of ordered pairs on the coordinate plane.
You can now use the ordered pairs to plot each point on a coordinate plane.
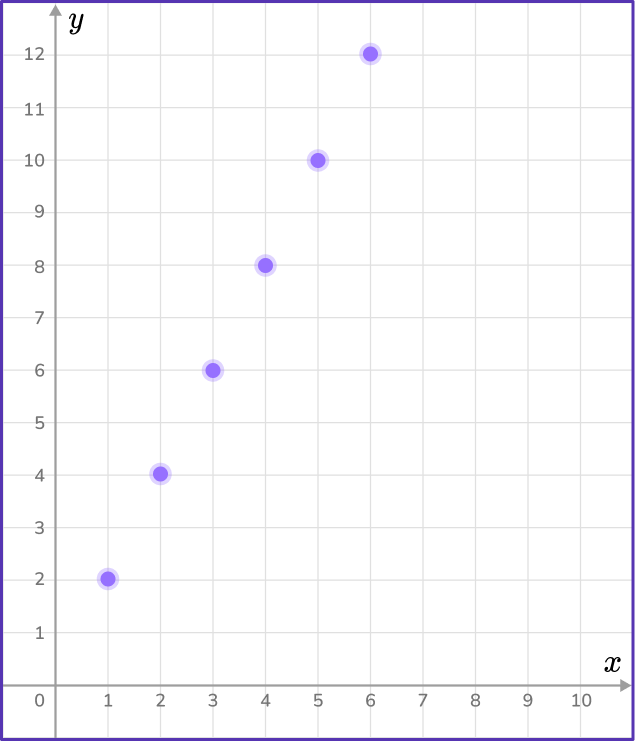
Draw a line from the origin to connect the points.
Draw a straight line from the origin (0,0) through each point.
Example 5: plot points on a coordinate plane using input/output tables
The table below represents the number of baseball cards Phillip has collected for the last 6 months. Graph the data on the coordinate plane.

Use pairs of corresponding terms to create an ordered pair.
The data in the week column will represent the variable x, and the data in the miles column will represent the y variable.

Graph each set of ordered pairs on the coordinate plane.
You can now use the ordered pairs to plot each point on a coordinate plane.
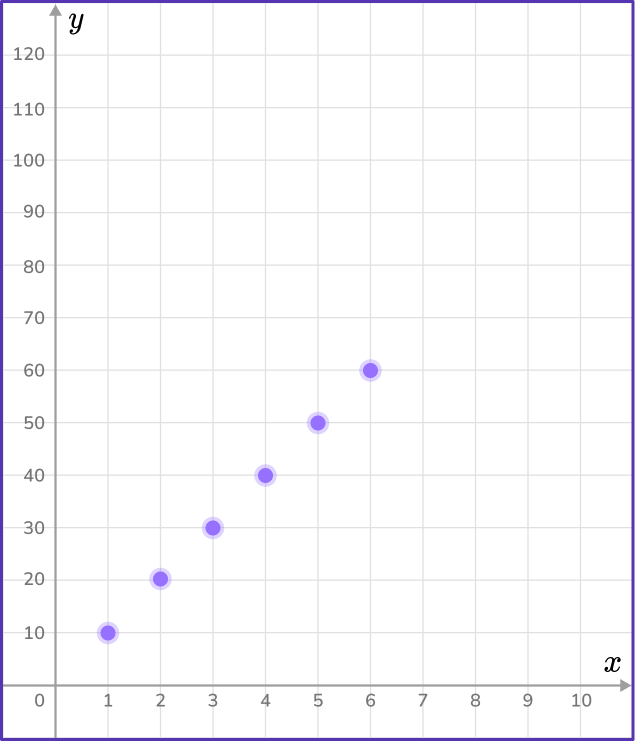
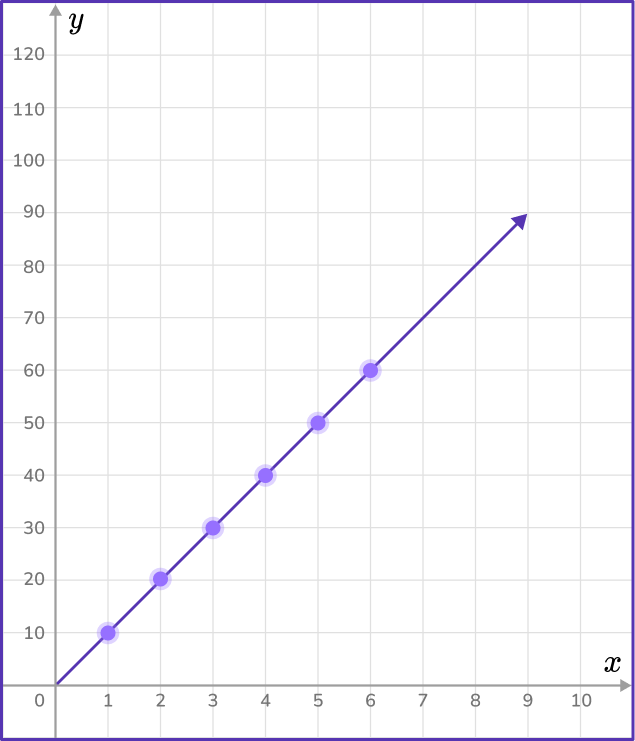
Draw a line from the origin to connect the points.
Draw a straight line from the origin (0,0) through each point.
Example 6: plot points on a coordinate plane using input/output tables word problem
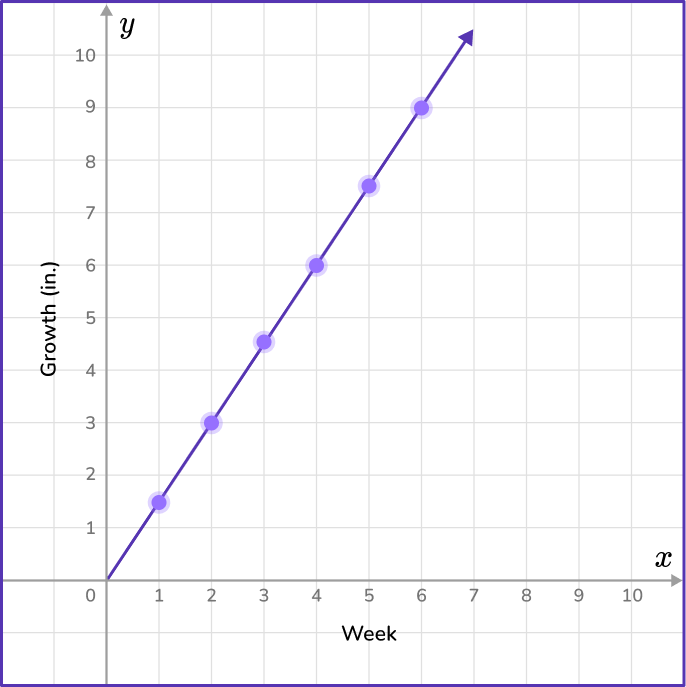
Mrs. Vasek’s 6 th grade class recorded the growth of a class plant over time. The input/output table below represents the growth of the class plant over 6 weeks. Graph the data on a coordinate plane.

Use pairs of corresponding terms to create an ordered pair.
The data in the week column will represent the variable x, and the data in the growth column will represent the y variable.

Graph each set of ordered pairs on the coordinate plane.
You can now use the ordered pairs to plot each point on a coordinate plane.
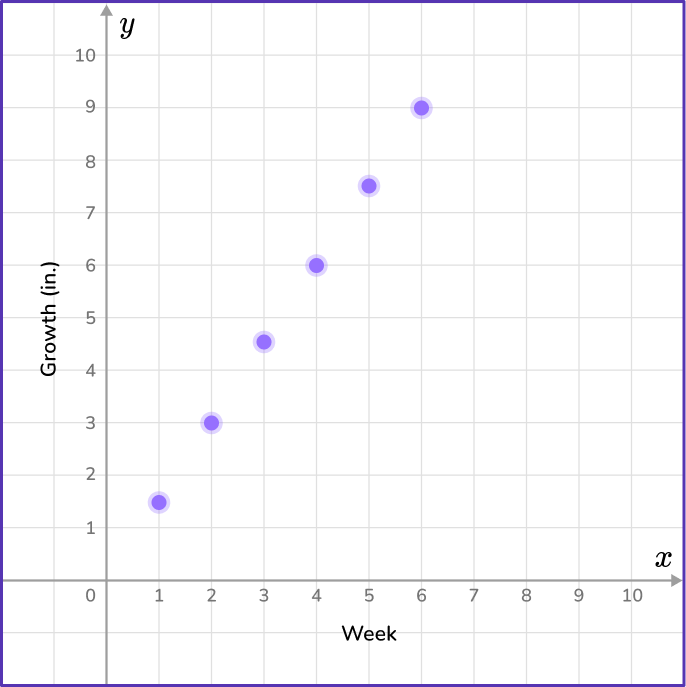
Draw a line from the origin to connect the points.
Draw a straight line from the origin (0,0) through each point.
Teaching tips for input/output tables
- Instead of providing students with worksheets to practice with, allow students to create their own input/output tables, leaving blanks and having other students fill in the missing values.
- Practice with mental math and place value can assist learners with identifying patterns and rules.
Easy mistakes to make
- Confusing the input and output columns
Always check how each column is labeled to be sure which column represents each set of data. Not doing so can lead to confusion or mistakes.
- Not identifying the pattern
There is always a rule or pattern in input/output tables. Carefully analyze each input/output table to ensure you identify the correct pattern.
- Ignoring negative numbers or fractions
Input/output tables can involve negative numbers and fractions. Ignoring these can lead to errors, so it’s important to pay attention to the signs and any fractional components of each value.
Related number patterns lessons
Practice input/output tables questions
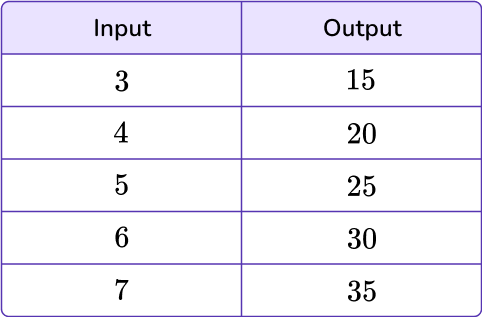
1) What is the rule in the given input/output table?
Add 12

Divide by 5

Subtract 12

Multiply by 5

To identify the pattern, analyze the given values within the table.
The input 3 turns into the output 15, which means either adding 12 or multiplying by 5. In order for it to be a rule, it must be true of all values within the table.
Try with the remaining inputs:
4+12=16 or 4 \times 5=20 \rightarrow multiplying by 5
5+12=17 or 5 \times 5=25 \rightarrow multiplying by 5
6+12=18 or 6 \times 5=30 \rightarrow multiplying by 5
7+12=19 or 7 \times 5=35 \rightarrow multiplying by 5
The rule is: multiply by 5.
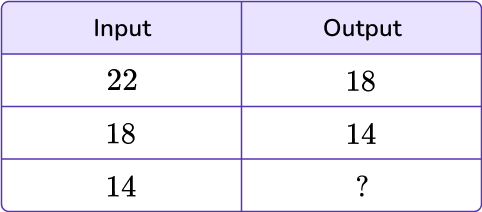
2) What is the missing value in the given input/output table?


To identify the pattern, analyze the given values within the table.
The input 22 turns into the output 18, which means either subtracting 4. In order for it to be a rule, it must be true of all values within the table.
Try with the remaining inputs:
\begin{aligned} & 18-4=14 \\\\ & 10-4=6 \\\\ & 6-4=2 \end{aligned}
The rule is subtracting 2. Use this to find the missing value.
14-4=10
The missing value is 10.
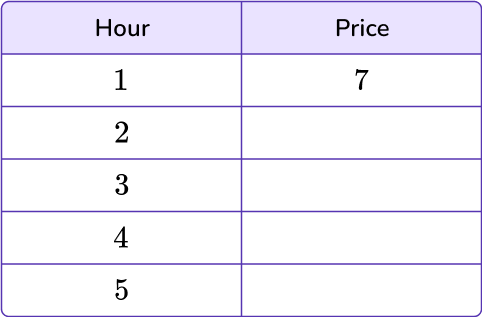
3) Stefan is renting a scooter to get around town. It costs \$7 for each hour he rents the scooter. If he rents the scooter for 5 hours, how much will Stefan pay?


To identify the pattern, analyze the given values within the table.
Each hour that Stefan keeps the scooter will cost him \$7. For 1 hour, it’s 7 dollars. For the second hour, calculate 7 + 7 = 14, or 7 \times 2=14. The rule will be to multiply by 7.
Calculate the remaining outputs to find the total cost that Stefan paid.
\begin{aligned} & 7 \times 2=14 \\\\ & 7 \times 3=21 \\\\ & 7 \times 4=28 \\\\ & 7 \times 2=35 \end{aligned}
Stefan paid \$35 to rent the scooter.
4) The table below represents the number of seashells that Cadace collected over 6 days at the beach. Which set of points represents the data shown in the table below?

(3,1), \, (6,2), \, (9,3), \, (12,4), \, (15,5), (18,6)

(1,3), \, (2,6), \, (3,9), \, (4,12), \, (5,15), (6,18)

(1,4), \, (2,8), \, (3,12), \, (4,16), \, (5,20), (6,24)

(1,2), \, (3,4), \, (5,6), \, (3,6), \, (9,12), (15,18)

The data in the day column will represent the variable x, and the data in the shells column will represent the y variable.

The coordinates for this table are: (1,3), (2,6), (3,9), (4,12), (5,15), (6,18).
5) Cameron goes to band camp each summer for 15 days. He goes for 5 consecutive years. Which coordinate plane shows the number of days Cameron spends at band camp?

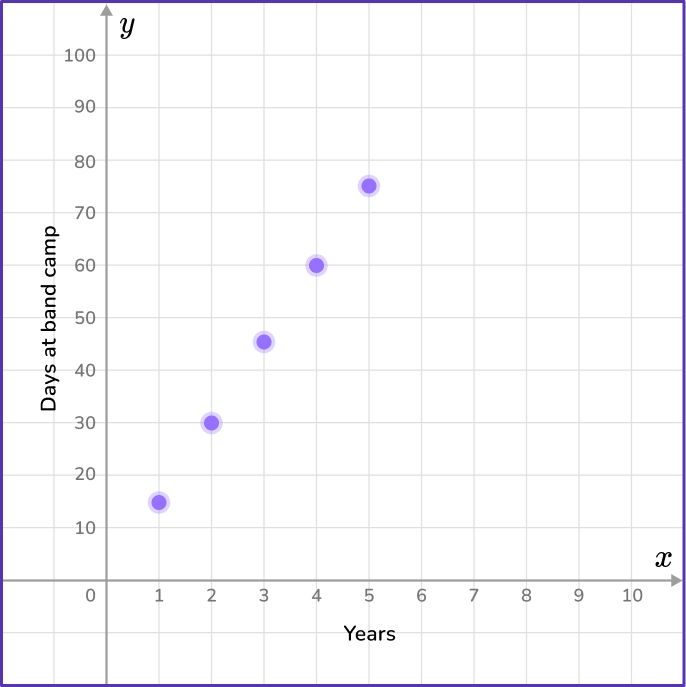

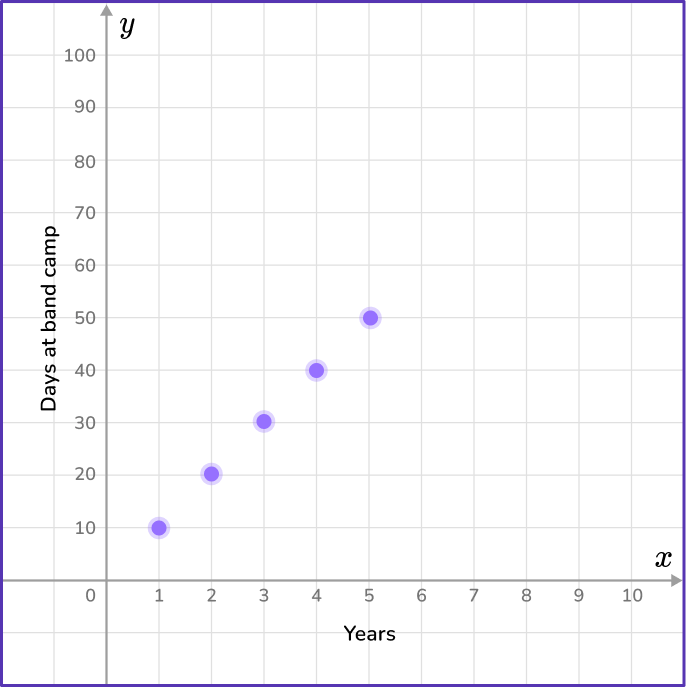

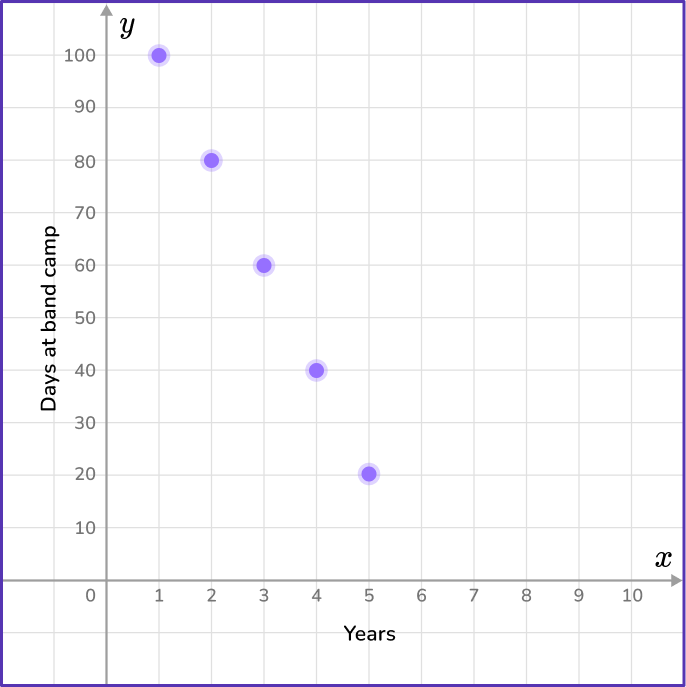

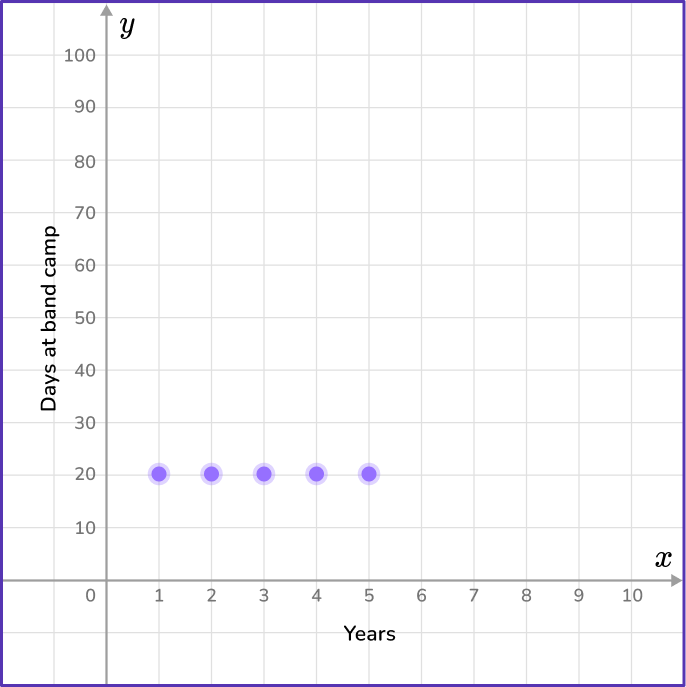

The data in the day column will represent the variable x, and the data in the shells column will represent the y variable.
Use the data given to create points that will be graphed on the coordinate grid.

Find the coordinate grid that contains the points (1,15), (2,30), (3,45), (4,60) and (5,75).
6) Nora’s 8 th grade teacher gives her 16 pencils at the beginning of each month. The chart below represents the number of pencils she uses each week. Which coordinate plane shows the number of pencils Nora has at the end of the month?

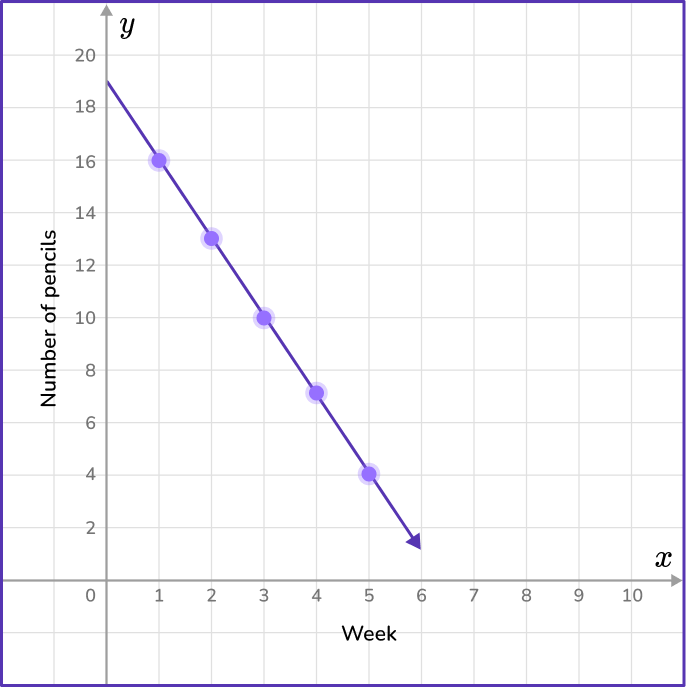

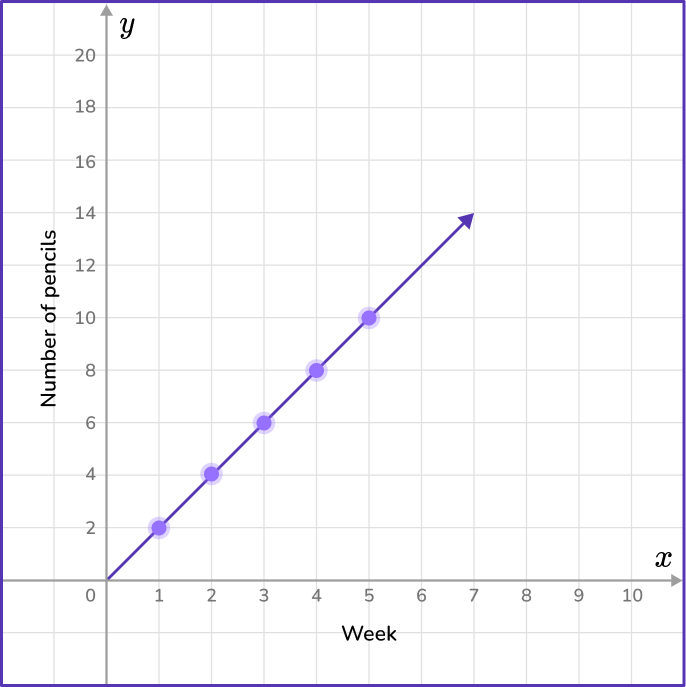

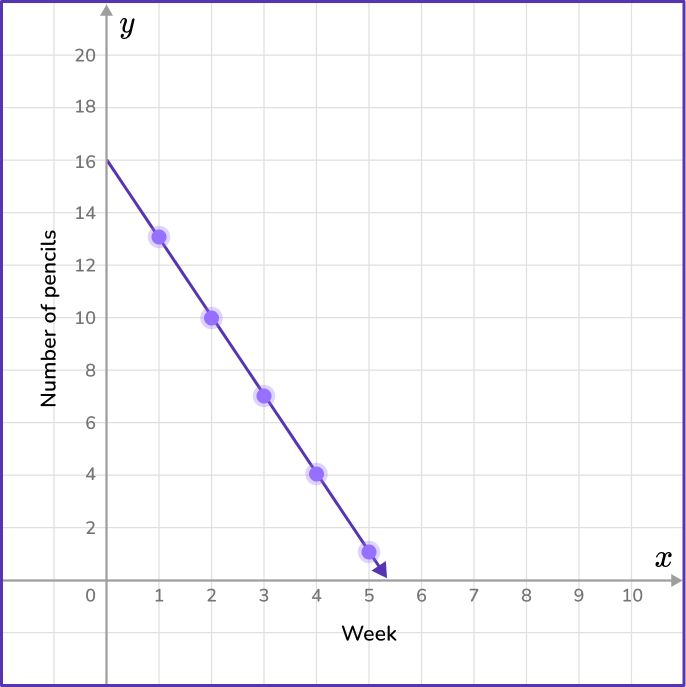

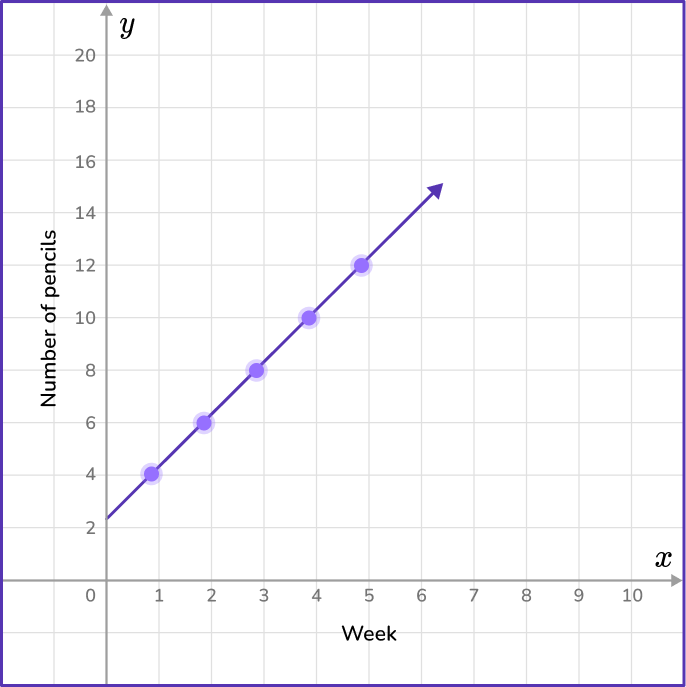

The data in the week column will represent the variable x, and the data in the pencils column will represent the y variable.
Use the data given to create points that will be graphed on the coordinate grid.

Find the coordinate grid that contains the points (1,13), (2,10), (3,7), (4,4) and (5,1).
Input/output tables FAQs
The biggest difference lies in the emphasis on mathematical functions in function tables, including the presence of a function rule and the requirement for unique outputs for each input. Input/output tables may represent various types of relationships, and the terminology might be used more broadly depending on the educational context.
Input/output tables focus on the relationship between input and output values in a function; ratios provide a way to express and analyze the relationship between two quantities.
The next lessons are
Still stuck?
At Third Space Learning, we specialize in helping teachers and school leaders to provide personalized math support for more of their students through high-quality, online one-on-one math tutoring delivered by subject experts.
Each week, our tutors support thousands of students who are at risk of not meeting their grade-level expectations, and help accelerate their progress and boost their confidence.

Find out how we can help your students achieve success with our math tutoring programs.
[FREE] Common Core Practice Tests (3rd to 8th Grade)
Prepare for math tests in your state with these 3rd Grade to 8th Grade practice assessments for Common Core and state equivalents.
Get your 6 multiple choice practice tests with detailed answers to support test prep, created by US math teachers for US math teachers!