High Impact Tutoring Built By Math Experts
Personalized standards-aligned one-on-one math tutoring for schools and districts
In order to access this I need to be confident with:
Coordinates
Inequality symbol
Linear inequalitiesGraphing inequalities
Here you will learn about graphing inequalities, including what they look like on a graph, horizontal lines, vertical lines, systems of inequalities and shading regions.
Students will first learn about graphing inequalities as a part of expressions and equations in grade 6 and will expand on that knowledge into high school math.
What are graphing inequalities?
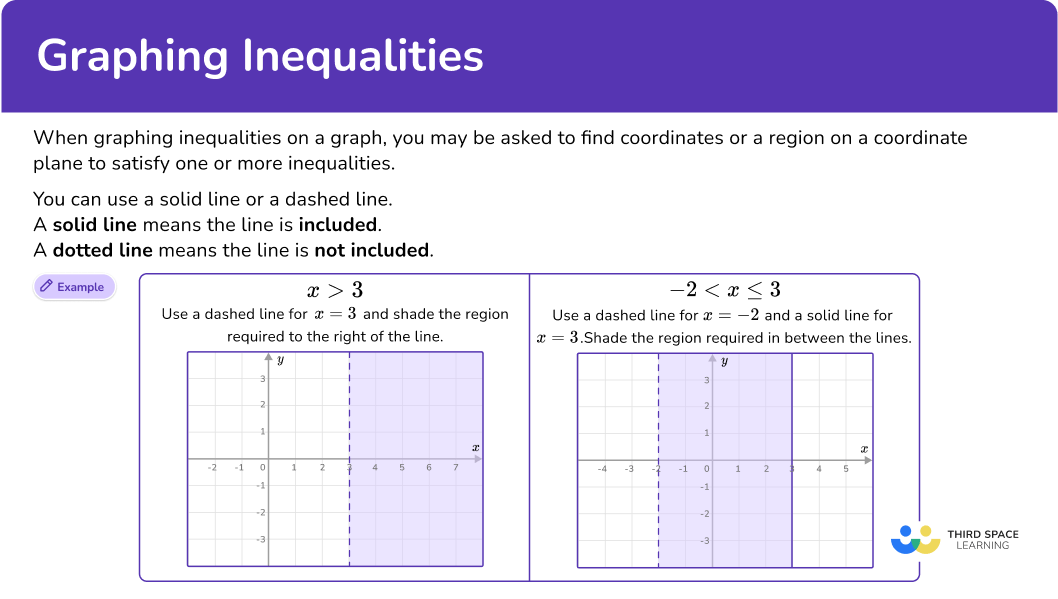
Graphing inequalities allows you to visualize the regions that satisfy one or more inequalities.
These inequalities are often linear and can be expressed using straight line graphs. You may have to use graphs already provided to find solutions to the inequalities or you may need to draw lines and indicate a region that satisfies the system of inequalities.
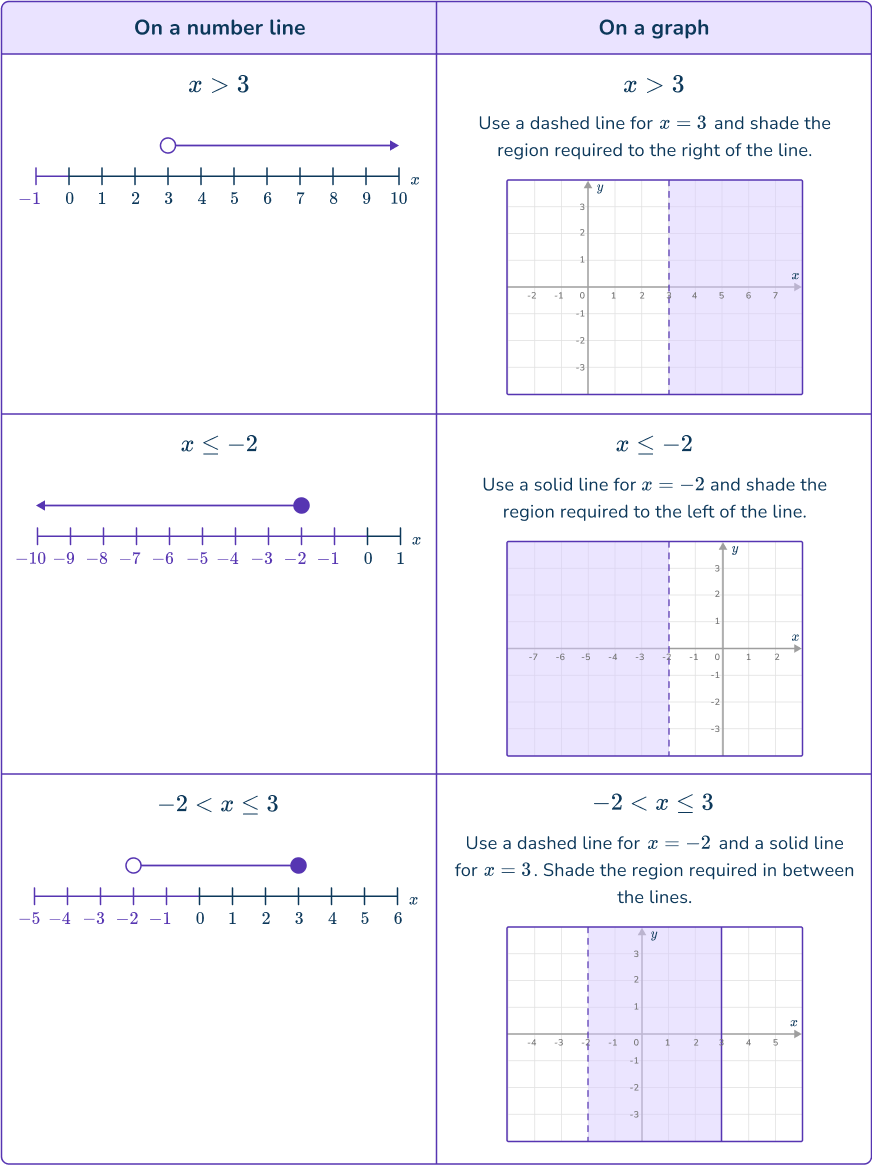
To do this, use the linear equations to plot straight line graphs using a boundary line, which is either a solid line or a dashed line.
A solid line means the line is included.
A dashed/dotted line means the line is not included.
This is similar to using the solid (or closed) circle and open circles when displaying inequalities on a number line.
See also: Plot points on a graph
It is important to indicate the region required using the method requested in the question.
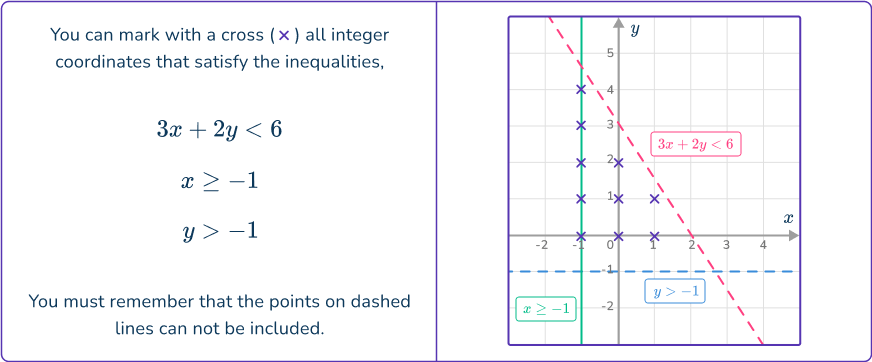
The question may ask you to shade a region required, it may ask you to indicate the region with a letter or it may ask you to indicate integer coordinates that satisfy a system of inequalities with crosses.
To get the correct region, think about what coordinates will satisfy the inequality.
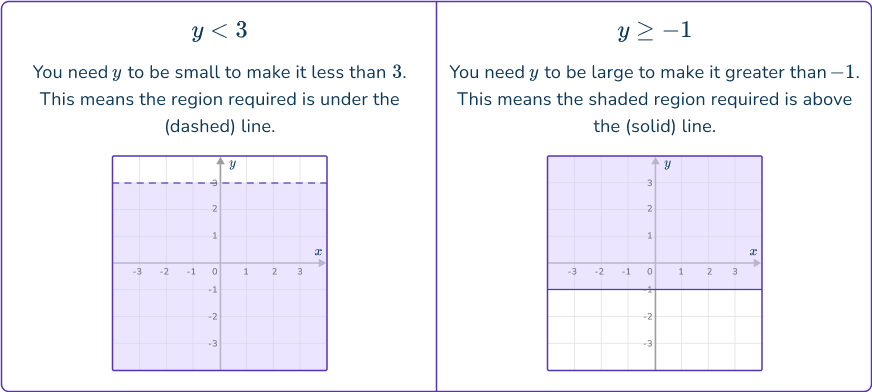
For horizontal inequality lines in the form y<a or y>a, you need to think about what the y -coordinate could be.
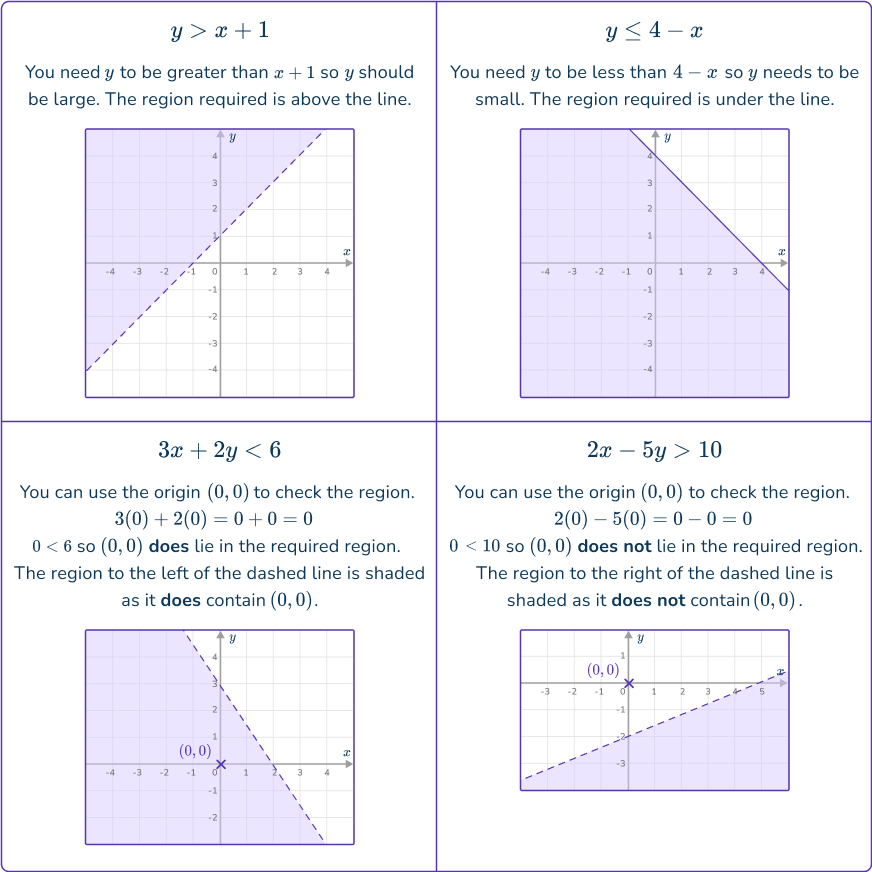
For lines that are not vertical or horizontal you can use the same thinking to find the correct region, or substitute a coordinate, such as the origin (0, 0) into the inequality to test the validity.
![[FREE] Graphing Inequalities Worksheet (High School)](https://thirdspacelearning.com/wp-content/uploads/2024/11/Graphing-Inequalities-Worksheet-listing-image.png)
[FREE] Graphing Inequalities Worksheet (High School)
![[FREE] Graphing Inequalities Worksheet (High School)](https://thirdspacelearning.com/wp-content/uploads/2024/11/Graphing-Inequalities-Worksheet-listing-image.png)
Use this worksheet to check your high school students’ understanding of graphing inequalities. 15 questions with answers to identify areas of strength and support!
DOWNLOAD FREE![[FREE] Graphing Inequalities Worksheet (High School)](https://thirdspacelearning.com/wp-content/uploads/2024/11/Graphing-Inequalities-Worksheet-listing-image.png)
[FREE] Graphing Inequalities Worksheet (High School)
![[FREE] Graphing Inequalities Worksheet (High School)](https://thirdspacelearning.com/wp-content/uploads/2024/11/Graphing-Inequalities-Worksheet-listing-image.png)
Use this worksheet to check your high school students’ understanding of graphing inequalities. 15 questions with answers to identify areas of strength and support!
DOWNLOAD FREESystem of inequalities
For a system of inequalities you need to draw the regions that satisfy all of the inequalities stated.
For example:
What are graphing inequalities?
Common Core State Standards
How does this relate to 6 th grade math and high school math?
- Grade 6: Expressions and Equations (6.EE.B.8)
Write an inequality of the form x>c or x<c to represent a constraint or condition in a real-world or mathematical problem.
Recognize that inequalities of the form x>c or x<c have infinitely many solutions; represent solutions of such inequalities on number line diagrams.
- High School: Algebra (HS.A.REI.D.12)
Graph the solutions to a linear inequality in two variables as a half plane (excluding the boundary in the case of a strict inequality), and graph the solution set to a system of linear inequalities in two variables as the intersection of the corresponding half-planes.
How to graph inequalities
In order to graph inequalities:
- Find a set of coordinates that satisfy a line given by the inequality.
- Join the points using a dashed line or a solid line.
- Indicate the points that satisfy the inequality.
Graphing inequalities examples
Example 1: shading a region for a single inequality
Shade the region that satisfies the inequality x>- \, 4.
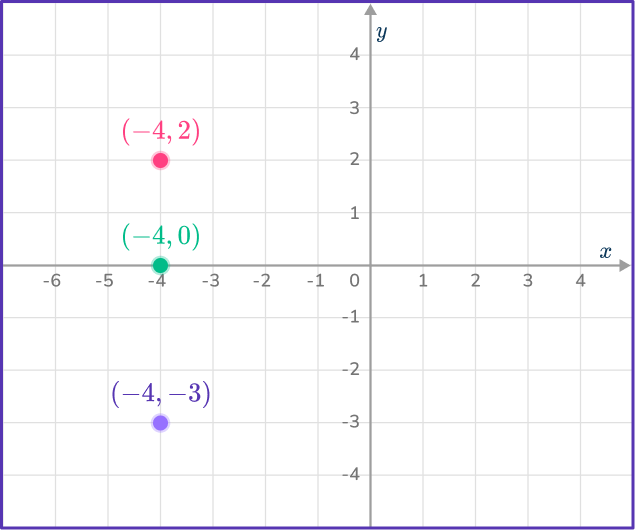
- Find a set of coordinates that satisfy a line given by the inequality.
You need points on the line x>- \, 4.
These are ordered pairs such as, (- \, 4,- \, 3), (- \, 4,0), (- \, 4,2), …
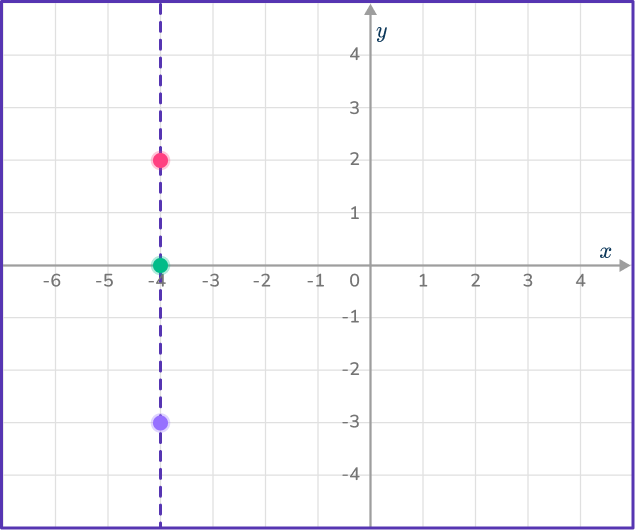
2Join the points using a dashed line or a solid line.
x>- \, 4 will require a dashed line as the inequality is only greater than - \, 4, not equal to.
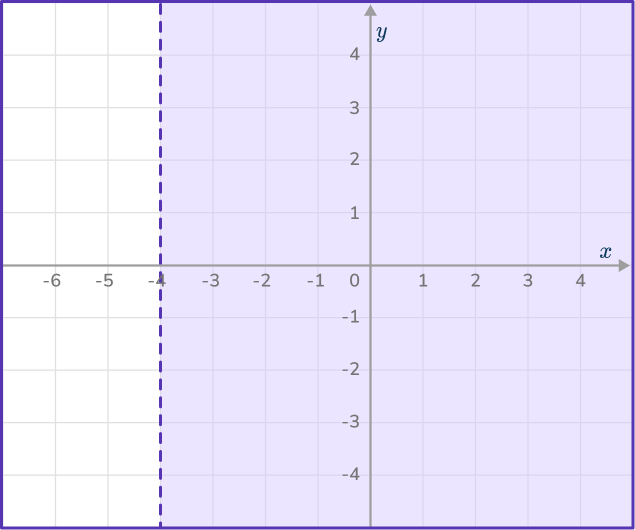
3Indicate the points that satisfy the inequality.
You want the values of x that are greater than - \, 4, so shade the right hand side of the line.
Example 2: shade a region between two inequalities
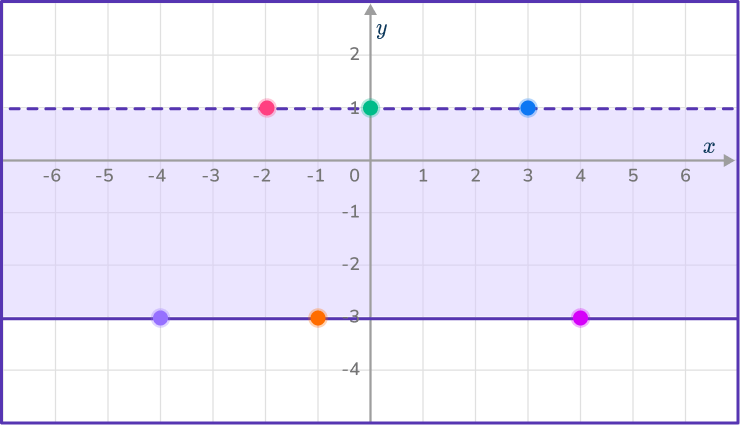
Shade the region that satisfies the inequality - \, 3\leq{y}<1.
You need to determine points on the lines y=- \, 3 and y=1.
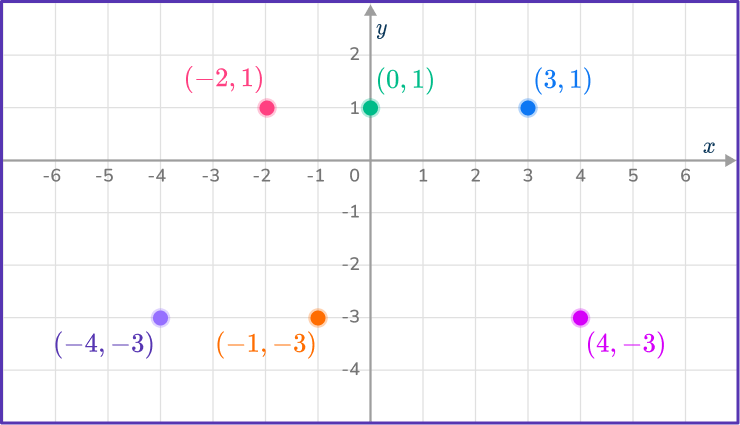
Join the points on y=- \, 3 with a solid line as y is greater than or equal to - \, 3, and the points on y=1 with a dashed line as y is less than 1, not equal to.
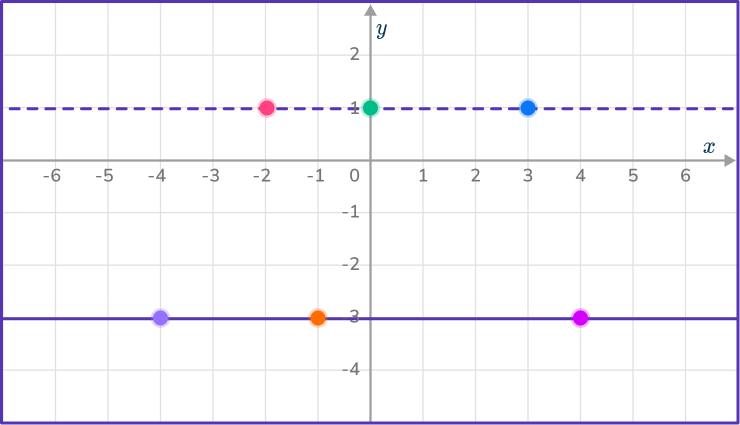
You are looking for y values between - \, 3 and 1, so shade the region in between the two lines.
Example 3: shade the region for an inequality with a line in the form y = mx + c
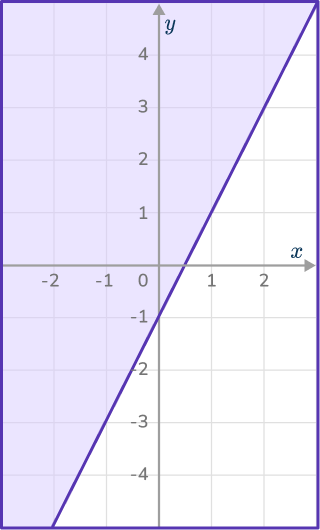
Shade the region that satisfies y\geq{2x}-1.
Make a table of values for the line y=2x-1.

Plot the points and join with a solid line for the \geq symbol.
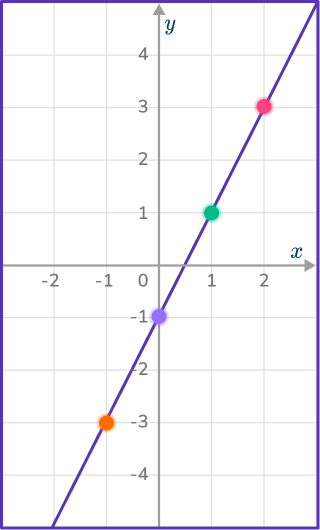
y needs to be greater than or equal to 2x-1, so y needs to be large.
By testing the coordinate (0, 0),
2(0)-1=- \, 1
0\geq{- \, 1} so (0, 0) does lie in the region so shade above the line.
Example 4: indicate a region for an inequality with a line in standard form ax + by = c
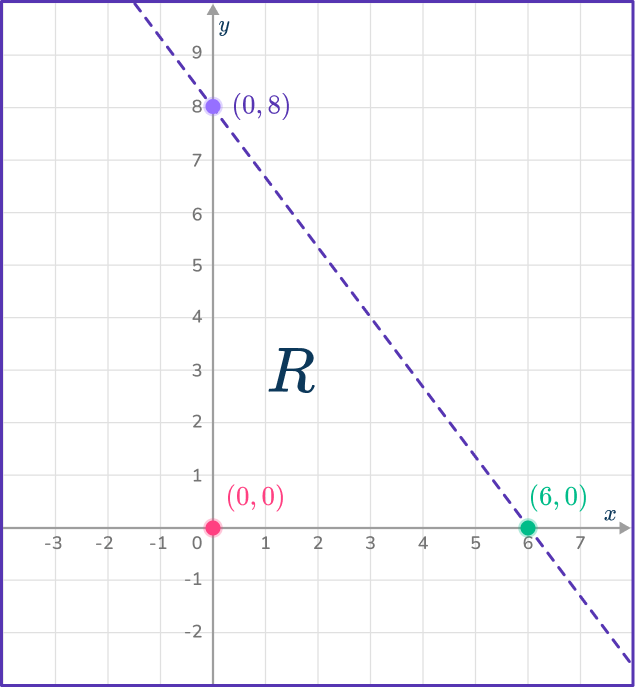
Indicate the region that satisfies the inequality 4x+3y<24 with an R.
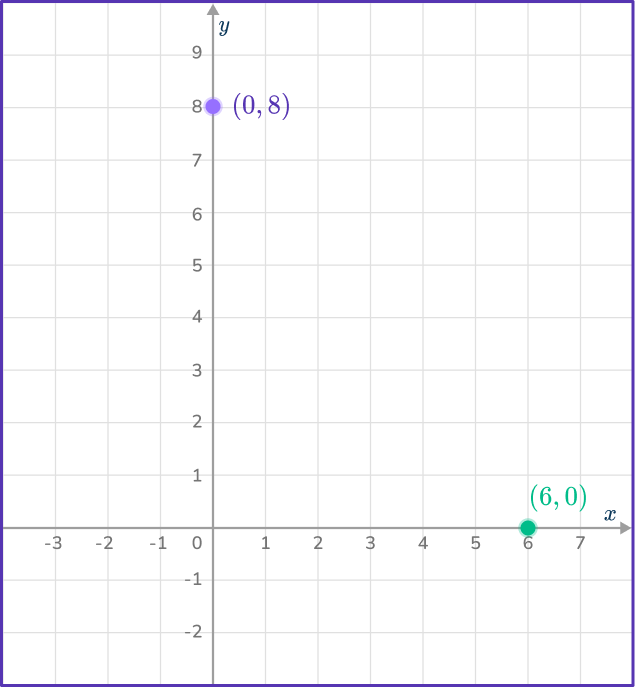
The line 4x+3y=24 can be plotted using a table of values or by finding the y intercept and x intercept by substituting x=0 for the y intercept and y=0 for the x intercept.
When x=0,
4(0)+3y=24 gives y=8.
When y=0,
4x+3(0)=24 gives x=6.
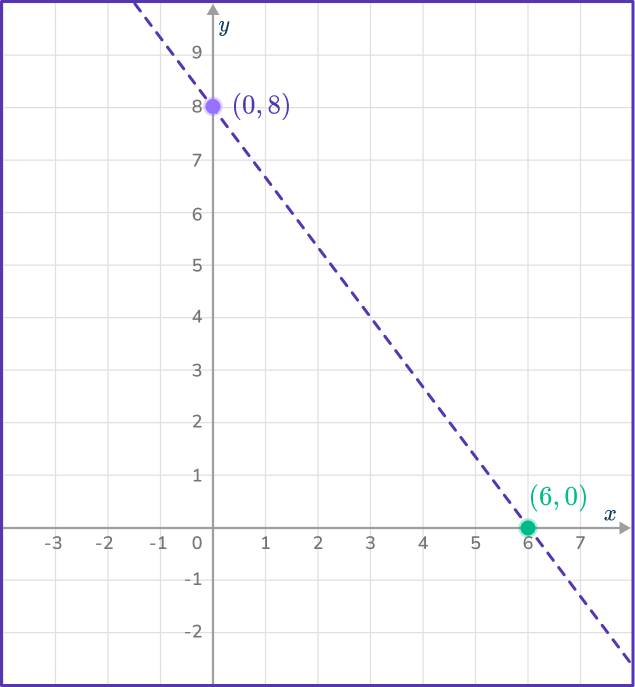
The line 4x+3y=24 goes through the points (0,8) and (6,0).
Join the points with a dashed line.
Using the point (0,0),
4(0)+3(0)<24. Therefore, (0,0) satisfies the inequality.
Write an R to the left of the line.
Example 5: indicating a region that satisfies a system of inequalities
Mark with a cross (x) the integer coordinates that satisfy
x+y>5, x<2 and y\leq{7}.
x+y=5 goes through the points (0,5), (1,4), (2,3).
x=2 is a vertical line through (2,0).
y=7 is a horizontal line through (0,7).
Plot the points and lines using dashed lines for x+y>5 and x<2 and a solid line for y\leq{7}.
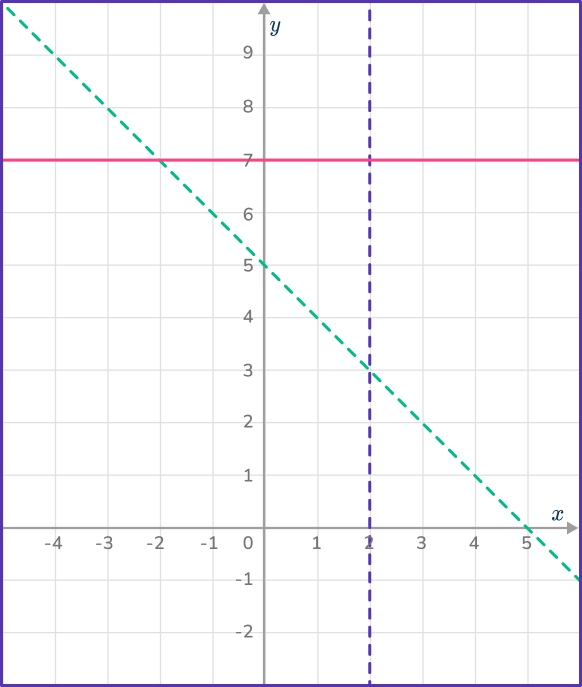
x+y>5 means the integer coordinates must be above x+y=5.
x<2 means the integer coordinates must be the the left of x=2.
y\leq7 means the integer coordinates must be on or below y=7.
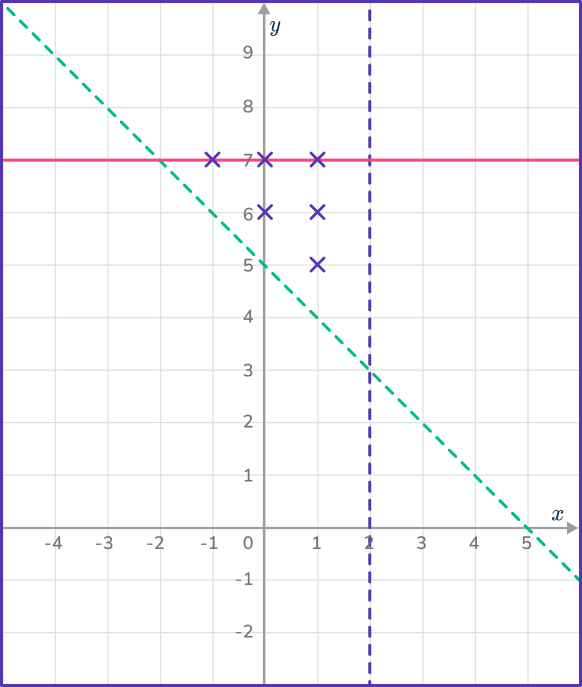
The integer solutions would be:
(- \, 1, 7), (0, 6), (0, 7), (1, 5), (1, 6), (1, 7).
Teaching tips for graphing inequalities
- Use visual aids, such as number lines and graphs, to allow students to visually see the inequalities. The use of color coding when first introducing graphing inequalities allows for better visual distinction with the boundary lines and shaded areas.
- Incorporate appropriate technology when working with students. There are numerous graphing calculators and software available online that can be another tool for students. Interactive whiteboards are an amazing way to engage students while graphing inequalities.
- Providing students with timely feedback and support is important to not create misconceptions. Technology tools can be used for students to check their work in real time.
Easy mistakes to make
- Indicating the wrong side of the line with equations involving \textbf{y}
It is common to indicate the wrong side of the line that satisfies an inequality involving the variable y. The sight of a positive y> means it will be above the line, a positive y< means it will be below the line.
- Using the wrong type of line
When drawing lines it is important to use a dashed line for inequalities in using the symbol < or >. There may be questions using these symbols with solid lines already drawn – this sort of question will usually want you to indicate integer coordinates that satisfy the inequality.
- Indicating that points on a dashed line will satisfy the inequality
When dealing with inequalities that are strictly less than or greater than ( indicated by the symbol < or >), the points on the line are not included.
Related inequalities lessons
Practice graphing inequalities questions
1. The diagram shows a shaded region satisfying an inequality.
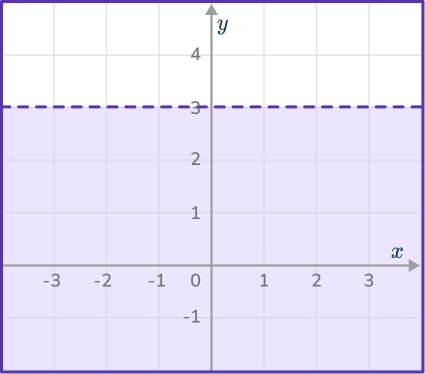
Select the correct inequality.


A horizontal dashed line means that the answer will not include x. The region that is shaded is below the line, meaning that the inequality is representing all of the values of y less than 3.
2. The diagram shows a shaded region satisfying an inequality.
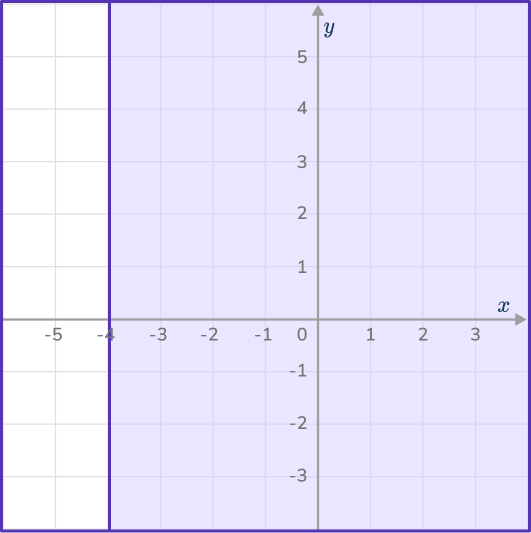
Select the correct inequality.


A vertical solid line means that the answer will include x. The region that is shaded is to the right side of the line, meaning that the inequality is representing all of the values greater than – \,4.
3. The diagram shows a shaded region satisfying an inequality.
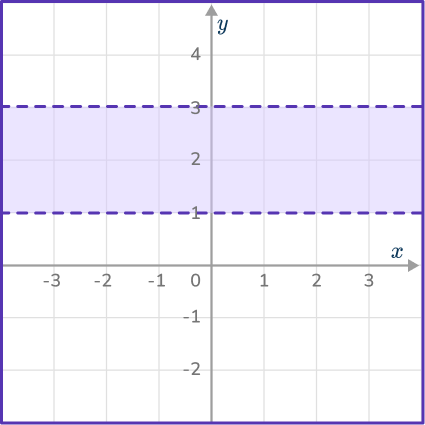
Select the correct inequality.


The inequality contains two horizontal dashed lines, meaning the values are not included. The region between 1 and 3 is shaded, meaning the value of y must be between the two values.
4. The diagram shows a shaded region satisfying an inequality.
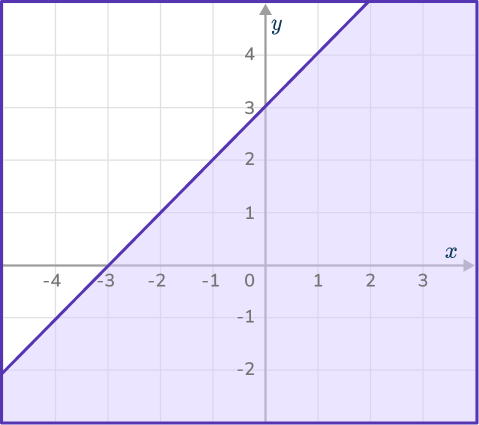
Select the correct inequality.


The solid line means that the answer will include the value. The region that is shaded is below the line, meaning that the inequality is representing all of the values less than only.
5. Which diagram indicates the region satisfied by the inequalities:
y\geq{x}, x\leq{4} and y\geq{1} ?
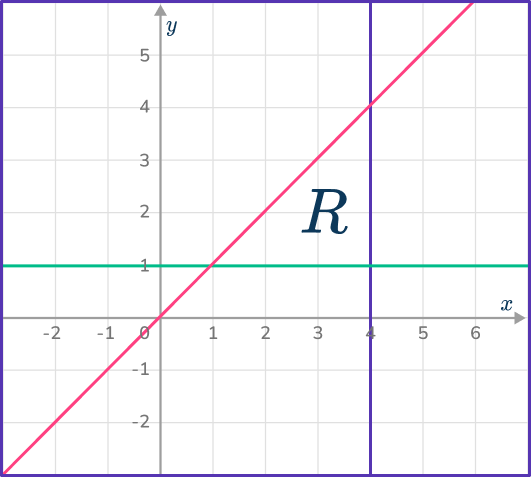

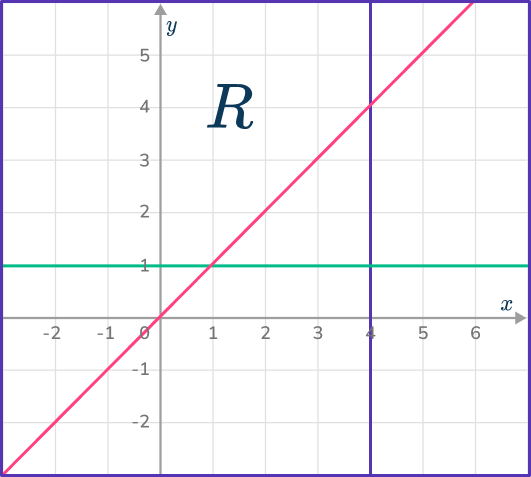

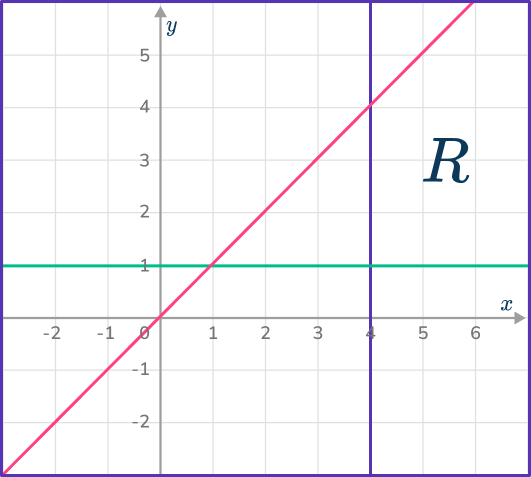

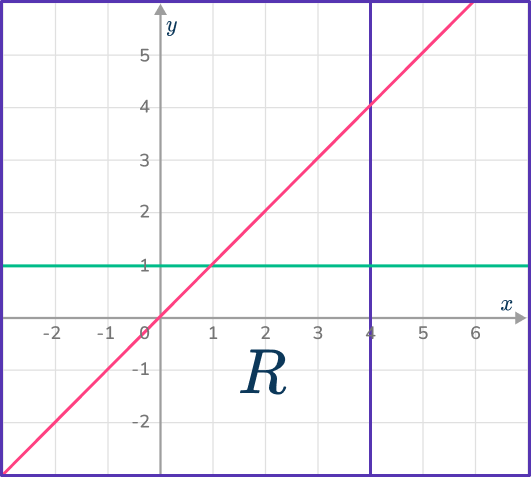

The region must be above the line y=x, the left of the line x=4 and above the line y=1.
6. Which diagram indicates the region satisfied by the inequalities:
y\geq{2}, 2x+y\leq{4} and x\geq{- \, 1}?
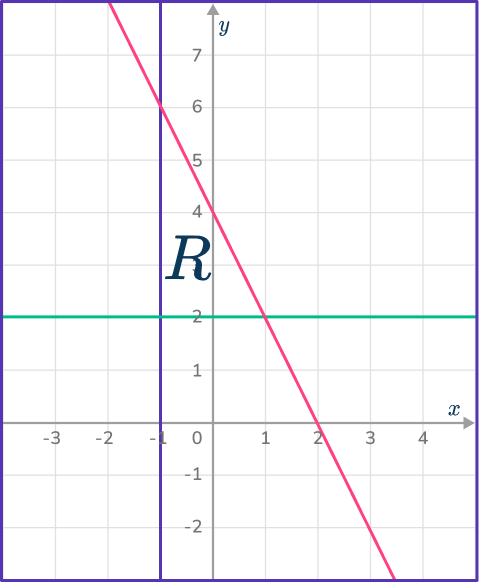

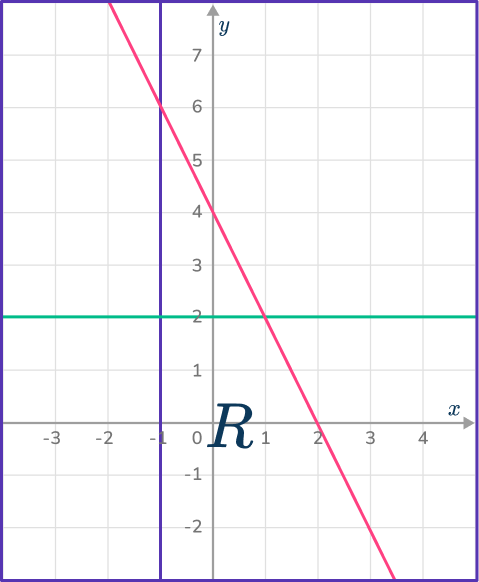

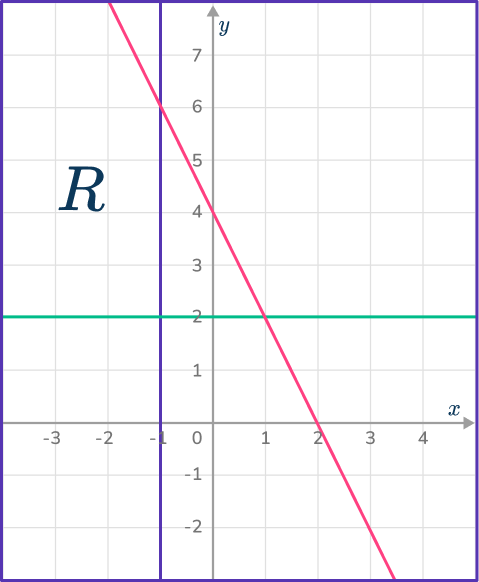

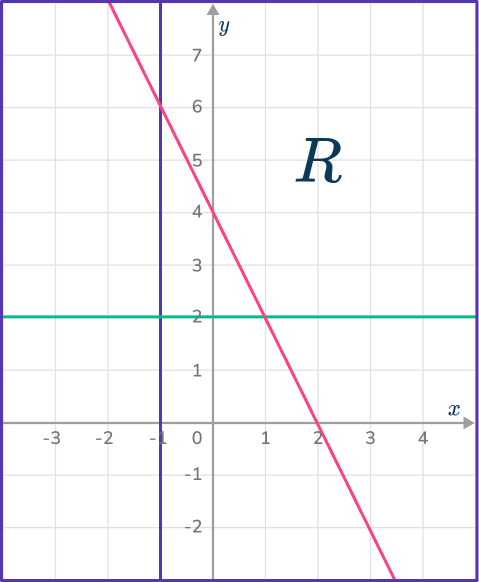

The region must be below the line 2x+y=4, above the line y=2 and to the right of the line x=- \, 1.
Graphing inequalities FAQs
An inequality is a mathematical statement that compares two expressions using inequality signs and symbols (‘<’, ‘>’, “\leq” \, “\geq”).
Similar to a system of equations, systems of inequalities is a set of two or more inequalities with the same variables. The solution to the system is the region where the shaded area of all the inequalities graphed intersect, or overlap. A system of equations uses an equal sign and a system of inequalities uses inequality signs.
Start with a linear equality written in slope-intercept form (y=mx+b). Next you will graph the boundary line, using either a solid line for “\leq” \, “\geq” or dashed line for ‘<’, ‘>’.
Then you will shade the appropriate region, if inequality y is less than or less than and equal to sign, shade below the line and if the inequality is greater than or greater than and equal to, shade above the line.
The next lessons are
Still stuck?
At Third Space Learning, we specialize in helping teachers and school leaders to provide personalized math support for more of their students through high-quality, online one-on-one math tutoring delivered by subject experts.
Each week, our tutors support thousands of students who are at risk of not meeting their grade-level expectations, and help accelerate their progress and boost their confidence.

Find out how we can help your students achieve success with our math tutoring programs.
[FREE] Common Core Practice Tests (3rd to 8th Grade)
Prepare for math tests in your state with these 3rd Grade to 8th Grade practice assessments for Common Core and state equivalents.
Get your 6 multiple choice practice tests with detailed answers to support test prep, created by US math teachers for US math teachers!