15 Venn Diagram Questions And Practice Problems (Middle & High School): Exam Style Questions Included
Venn diagram questions involve visual representations of the relationship between two or more different groups of things. Venn diagrams are first covered in elementary school and their complexity and uses progress through middle and high school.
This article will look at the types of Venn diagram questions that might be encountered at middle school and high school, with a focus on exam style example questions and preparing for standardized tests. We will also cover problem-solving questions. Each question is followed by a worked solution.
How to solve Venn diagram questions
In middle school, sets and set notation are introduced when working with Venn diagrams. A set is a collection of objects. We identify a set using braces. For example, if set A contains the odd numbers between 1 and 10, then we can write this as:
A = {1, 3, 5, 7, 9}
Venn diagrams sort objects, called elements, into two or more sets.
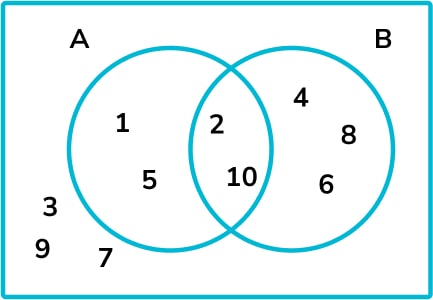
This diagram shows the set of elements
{1,2,3,4,5,6,7,8,9,10} sorted into the following sets.
Set A= factors of 10
Set B= even numbers
The numbers in the overlap (intersection) belong to both sets. Those that are not in set A or set B are shown outside of the circles.
Different sections of a Venn diagram are denoted in different ways.
ξ represents the whole set, called the universal set.
∅ represents the empty set, a set containing no elements.

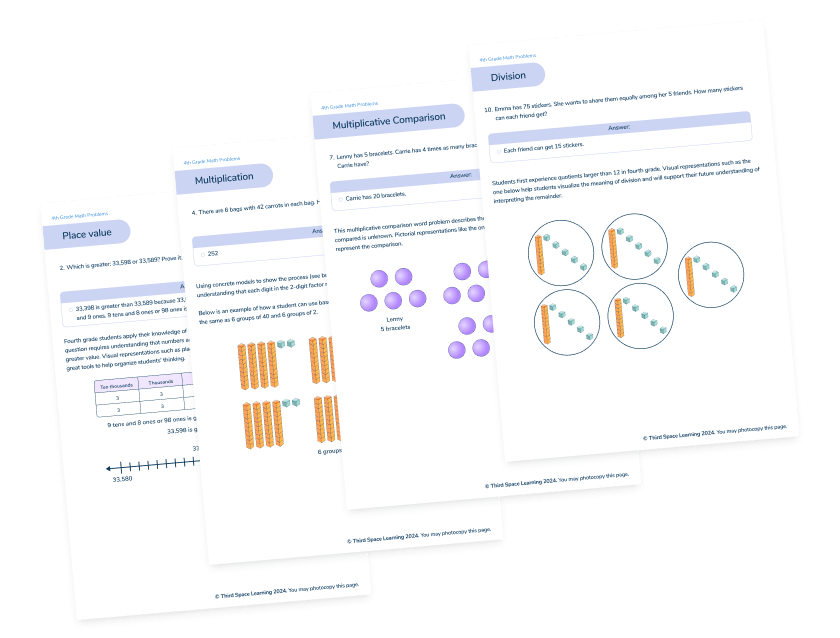
Venn Diagrams Worksheet
Download this quiz to check your students' understanding of Venn diagrams. Includes 10 questions with answers!
Download Free Now!Let’s check out some other set notation examples!
| A \cap B \quad
| ^{\prime}\mathrm{A} and B^{\prime}
The intersection of \mathrm{A} and \mathrm{B} . The elements in both sets \mathrm{A} and \mathrm{B.} \quad | 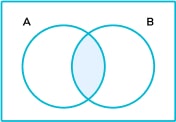 \; \; |
| A \cup B \quad
| ^{\prime}\mathrm{A} or B^{\prime}
The union of \mathrm{A} or \mathrm{B.} . Any element in set \mathrm{A} or set \mathrm{B.} | 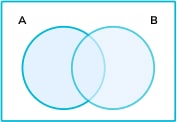 \; \; |
| A^{\prime}
| ‘Not \mathrm{A}^{\prime}
The complement of \mathrm{A.} Any element not in \mathrm{A.} | 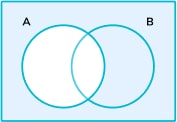 \; \; |
In middle school and high school, we often use Venn diagrams to establish probabilities.
We do this by reading information from the Venn diagram and applying the following formula.
\text{Probability}=\frac{\text{total number of outcomes}}{\text{number of desired outcomes}}
For Venn diagrams we can say
\text{P(A)}=\frac{\text{total number of elements}}{\text{number of elements in set A}}
Meet Skye, the voice-based AI tutor making math success possible for every student.
Built by teachers and math experts, Skye uses the same pedagogy, curriculum and lesson structure as our traditional tutoring.
But, with more flexibility and a low cost, schools can scale online math tutoring to support every student who needs it.
Find out more
Middle School Venn diagram questions
In middle school, students learn to use set notation with Venn diagrams and start to find probabilities using Venn diagrams. The questions below are examples of questions that students may encounter in 6th, 7th and 8th grade.
Venn diagram questions 6th grade
1. This Venn diagram shows information about the number of people who have brown hair and the number of people who wear glasses.
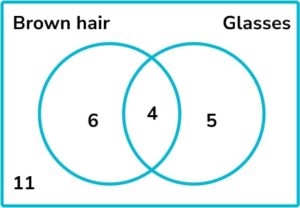
How many people have brown hair and glasses?


The intersection, where the Venn diagrams overlap, is the part of the Venn diagram which represents brown hair AND glasses. There are 4 people in the intersection.
2. Which set of objects is represented by the Venn diagram below?
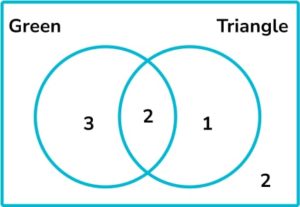
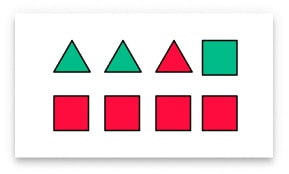
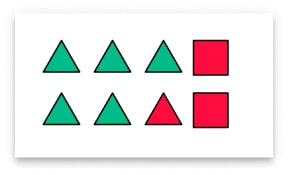
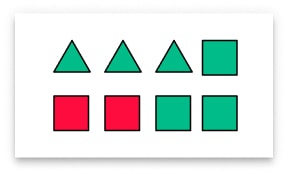
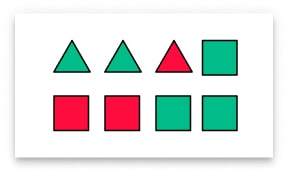
We can see from the Venn diagram that there are two green triangles, one triangle that is not green, three green shapes that are not triangles and two shapes that are not green or triangles. These shapes belong to set D.
Venn diagram questions 7th grade
3. Max asks 40 people whether they own a cat or a dog. 17 people own a dog, 14 people own a cat and 7 people own a cat and a dog. Choose the correct representation of this information on a Venn diagram.
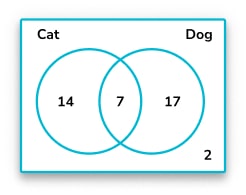
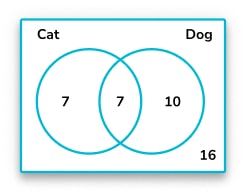
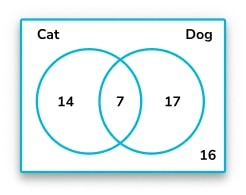
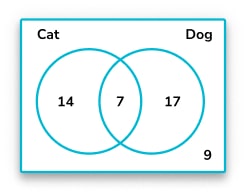
There are 7 people who own a cat and a dog. Therefore, there must be 7 more people who own a cat, to make a total of 14 who own a cat, and 10 more people who own a dog, to make a total of 17 who own a dog.
Once we put this information on the Venn diagram, we can see that there are 7+7+10=24 people who own a cat, a dog or both.
40-24=16 , so there are 16 people who own neither.
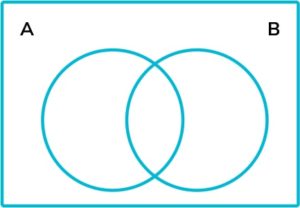
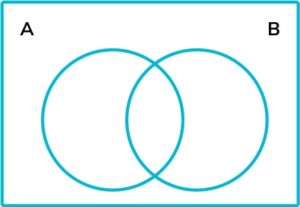
4. The following Venn diagrams each show two sets, set A and set B. On which Venn diagram has A′ been shaded?
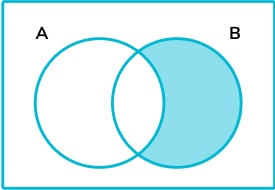
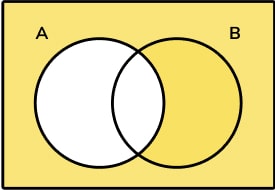
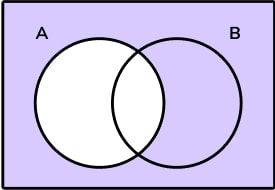
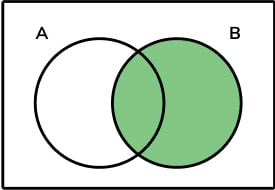
\mathrm{A}^{\prime} means not in \mathrm{A} . This is shown in diagram \mathrm{B.}
Venn diagram questions 8th grade
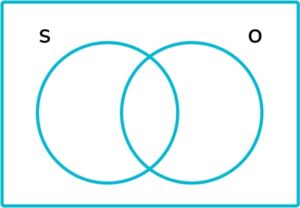
5. Place these values onto the following Venn diagram and use your diagram to find the number of elements in the set \text{S} \cup \text{O}.
\xi = \{1, 2, 3, 4, 5, 6, 7, 8, 9, 10\}
\text{S} = square numbers
\text{O} = odd numbers
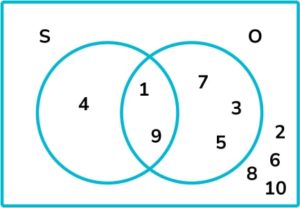
\text{S} \cup \text{O} is the union of \text{S} or \text{O} , so it includes any element in \text{S} , \text{O} or both. The total number of elements in \text{S} , \text{O} or both is 6.
6. The Venn diagram below shows a set of numbers that have been sorted into prime numbers and even numbers.
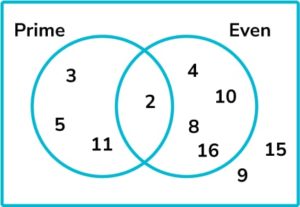
A number is chosen at random. Find the probability that the number is prime and not even.
The section of the Venn diagram representing prime and not even is shown below.
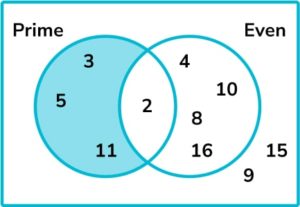
There are 3 numbers in the relevant section out of a possible 10 numbers altogether. The probability, as a fraction, is \frac{3}{10}.
7. Some people visit the theater. The Venn diagram shows the number of people who bought ice cream and drinks in the interval.
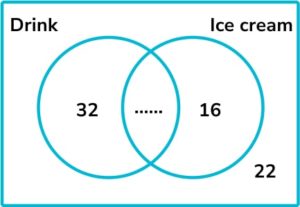
Ice cream is sold for $3 and drinks are sold for $2. A total of £262 is spent. How many people bought both a drink and an ice cream?
Money spent on drinks: 32 \times \$2 = \$64
Money spent on ice cream: 16 \times \$3 = \$48
\$64+\$48=\$112 , so the information already on the Venn diagram represents \$112 worth of sales.
\$262-\$112 = \$150 , so another \$150 has been spent.
If someone bought a drink and an ice cream, they would have spent \$2+\$3 = \$5.
\$150 \div \$5=30 , so 30 people bought a drink and an ice cream.
High school Venn diagram questions
In high school, students are expected to be able to take information from word problems and put it onto a Venn diagram involving two or three sets. The use of set notation is extended and the probabilities become more complex.
In advanced math classes, Venn diagrams are used to calculate conditional probability.
Lower ability Venn diagram questions
8. 50 people are asked whether they have been to France or Spain.
18 people have been to France. 23 people have been to Spain. 6 people have been to both.
By representing this information on a Venn diagram, find the probability that a person chosen at random has not been to Spain or France.
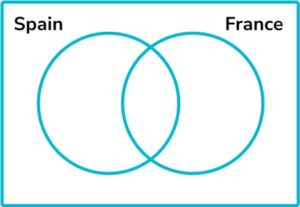
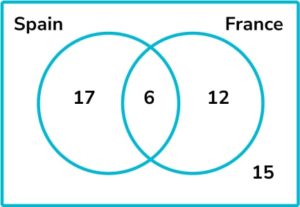
6 people have been to both France and Spain. This means 17 more have been to Spain to make 23 altogether, and 12 more have been to France to make 18 altogether. This makes 35 who have been to France, Spain or both and therefore 15 who have been to neither.
The probability that a person chosen at random has not been to France or Spain is \frac{15}{50}.
9. Some people were asked whether they like running, cycling or swimming. The results are shown in the Venn diagram below.
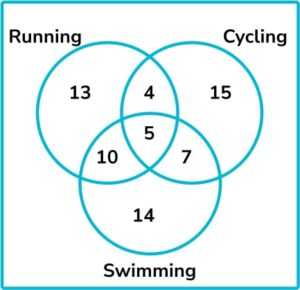
One person is chosen at random. What is the probability that the person likes running and cycling?
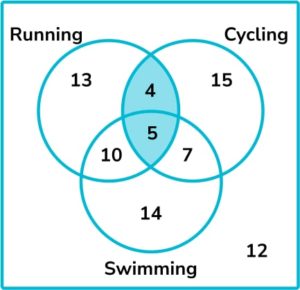
9 people like running and cycling (we include those who also like swimming) out of 80 people altogether. The probability that a person chosen at random likes running and cycling is \frac{9}{80}.
10. ξ = \{1, 2, 3, 4, 5, 6, 7, 8, 9, 10, 11, 12, 13, 14, 15, 16\}
\text{A} = \{ even numbers \}
\text{B} = \{ multiples of 3 \}
By completing the following Venn diagram, find \text{P}(\text{A} \cup \text{B}^{\prime}).
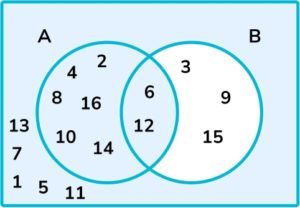
\text{A} \cup \text{B}^{\prime} means \text{A} or not \text{B} . We need to include everything that is in \text{A} or is not in \text{B} . There are 13 elements in \text{A} or not in \text{B} out of a total of 16 elements.
Therefore \text{P}(\text{A} \cup \text{B}^{\prime}) = \frac{13}{16}.
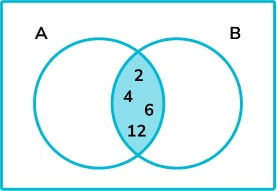
11. ξ = \{1, 2, 3, 4, 5, 6, 7, 8, 9, 10, 11, 12\}
A = \{ multiples of 2 \}
\begin{aligned} &\text{A} \cap \text{B}=\{2, 4, 6, 12\} \\ &\text{A} \cup \text{B}=\{1, 2, 3, 4, 6, 8, 10, 12\} \end{aligned}
By putting this information onto the following Venn diagram, list all the elements of B.
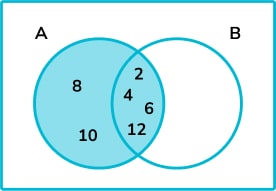
We can start by placing the elements in \text{A} \cap \text{B} , which is the intersection.
We can then add any other multiples of 2 to set \text{A}.
Next, we can add any unused elements from \text{A} \cup \text{B} to \text{B}.
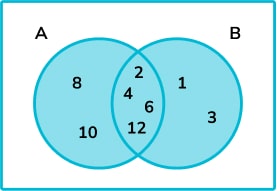
Finally, any other elements can be added to the outside of the Venn diagram.
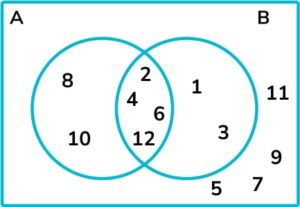
The elements of \text{B} are \{1, 2, 3, 4, 6, 12\}.
Middle ability high school Venn diagram questions
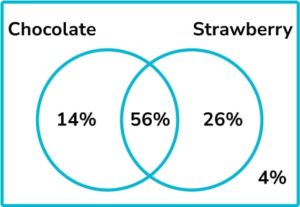
12. Some people were asked whether they like strawberry ice cream or chocolate ice cream. 82% said they like strawberry ice cream and 70% said they like chocolate ice cream. 4% said they like neither.
By putting this information onto a Venn diagram, find the percentage of people who like both strawberry and chocolate ice cream.
Here, the percentages add up to 156\%. This is 56\% too much. In this total, those who like chocolate and strawberry have been counted twice and so 56\% is equal to the number who like both chocolate and strawberry. We can place 56\% in the intersection, \text{C} \cap \text{S}
We know that the total percentage who like chocolate is 70\%, so 70-56 = 14\%-14\% like just chocolate. Similarly, 82\% like strawberry, so 82-56 = 26\%-26\% like just strawberry.
13. The Venn diagram below shows some information about the height and gender of 40 students.
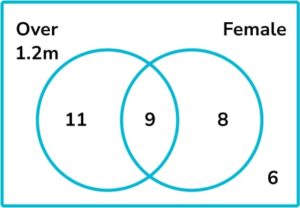
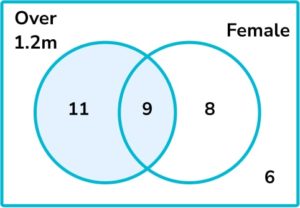
A student is chosen at random. Find the probability that the student is female given that they are over 1.2m.
We are told the student is over 1.2m. There are 20 students who are over 1.2m and 9 of them are female. Therefore the probability that the student is female given they are over 1.2m is \frac{9}{20}.
14. The Venn diagram below shows information about the number of students who study history and geography.
ξ = 100
H = history
G = geography
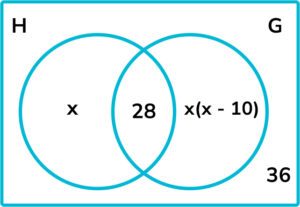
Work out the probability that a student chosen at random studies only history.
We are told that there are 100 students in total.
Therefore:
\begin{aligned} x+28+x(x-10)+36&=100\\\\ x+64+x^{2}-10x&=100\\\\ x^{2}-9x-36&=0\\\\ (x-12)(x+3)&=0 \end{aligned}
x = 12 or x = -3 (not valid)
If x = 12, then the number of students who study only history is 12, and the number who study only geography is 24. The probability that a student chosen at random studies only history is \frac{12}{100}.
15. 50 people were asked whether they like camping, holiday home or hotel holidays.
18\% of people said they like all three.
7 like camping and holiday homes but not hotels.
11 like camping and hotels.
\frac{13}{25} like camping.
Of the 27 who like holiday homes, all but 1 like at least one other type of holiday. 7 people do not like any of these types of holiday.
By representing this information on a Venn diagram, find the probability that a person chosen at random likes hotels given that they like holiday homes.
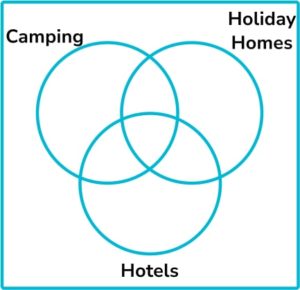
Put this information onto a Venn diagram.
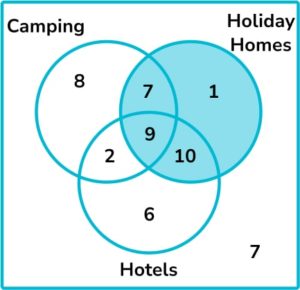
We are told that the person likes holiday homes. There are 27 people who like holiday homes. 19 of these also like hotels. Therefore, the probability that the person likes hotels given that they like holiday homes is \frac{19}{27}.
Looking for more Venn diagram math questions for middle and high school students?
Try these:
- Probability questions
- Ratio questions
- Algebra questions
- Trigonometry questions
- Long division questions
- Pythagorean theorem questions
Do you have students who need extra support in math?
Skye – our AI math tutor built by experienced teachers – provides students with personalized one-on-one, spoken instruction that helps them master concepts, close skill gaps, and gain confidence.
Since 2013, we’ve delivered over 2 million hours of math lessons to more than 170,000 students, guiding them toward higher math achievement.
Discover how our AI math tutoring can boost student success, or see how our math programs can support your school’s goals:
– 3rd grade tutoring
– 4th grade tutoring
– 5th grade tutoring
– 6th grade tutoring
– 7th grade tutoring
– 8th grade tutoring
The content in this article was originally written by secondary teacher Beki Christian and has since been revised and adapted for US schools by elementary math teacher Katie Keeton.