High Impact Tutoring Built By Math Experts
Personalized standards-aligned one-on-one math tutoring for schools and districts
In order to access this I need to be confident with:
Calculator skills Sequences FractionsPercentages
Systematic sampling
Here you will learn about systematic sampling, including what systematic sampling is, how systematic sampling works, and the advantages and disadvantages of systematic sampling.
Students will first learn about systematic sampling as part of statistics and probability in 7 th grade.
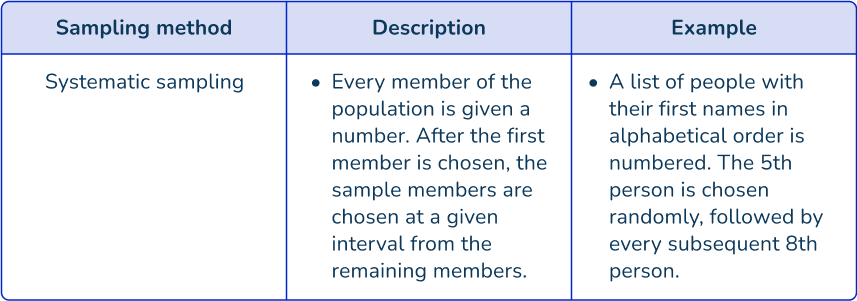
What is systematic sampling?
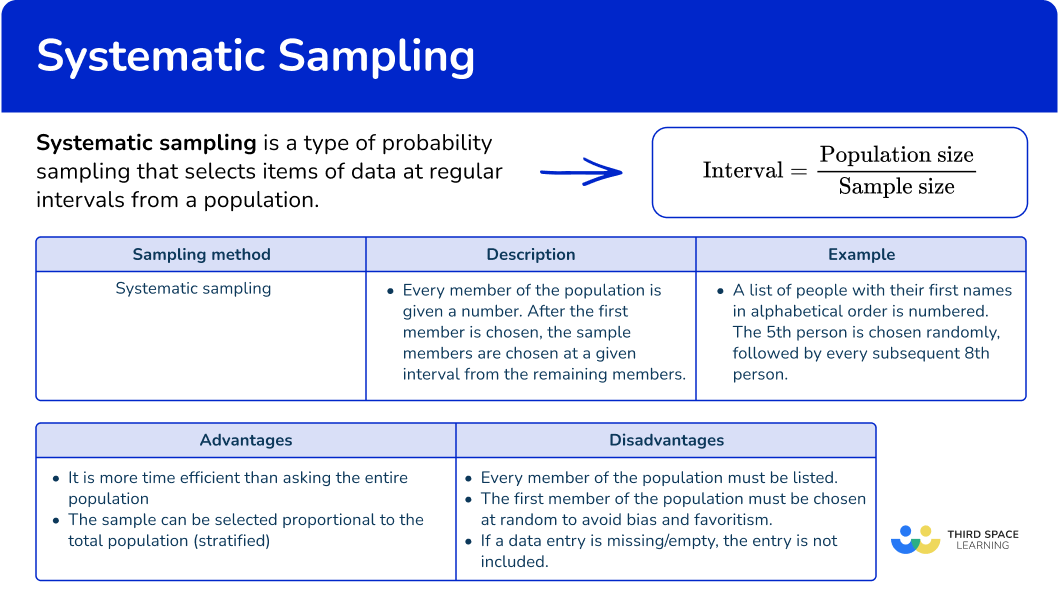
Systematic sampling is a type of probability sampling that selects items of data at regular intervals from a population.
Every data entry for the population must be given in a list (a sampling frame) so that they have an equal chance (equal probability) of being selected.
You select the first item of data using a random number generator and then select the rest at regular intervals (fixed intervals).
![[FREE] Probability Worksheet (Grade 7 to 12)](https://thirdspacelearning.com/wp-content/uploads/2023/07/Probability-check-for-understanding-quiz-listing-image.png)
[FREE] Probability Worksheet (Grade 7 to 12)
Teaching systematic sampling? Use this quiz to check your grade 7 to 12 students’ understanding of probability. 15+ questions with answers covering a range of probability topics to identify areas of strength and support!
DOWNLOAD FREE [FREE] Probability Worksheet (Grade 7 to 12)
Teaching systematic sampling? Use this quiz to check your grade 7 to 12 students’ understanding of probability. 15+ questions with answers covering a range of probability topics to identify areas of strength and support!
DOWNLOAD FREEThe sampling interval
To calculate the interval required to select the sample data, you calculate the size of the population divided by the size of the sample.
\text{Sampling interval}=\cfrac{\text{Population size}}{\text{Sample size}}
For example,
If the population size is 1200 and the desired sample size is 400 items of data, you divide 1200 by 400 to get an interval of 3. This means that every 3 rd item of data in the ordered list is selected for the sample.
For example,
A factory that manufactures cars must regularly assess the quality of production. In one month, 5 \% of cars are selected using a systematic sample to be rigorously tested for quality purposes. The first car is chosen at random then every 10 th car that follows.
This systematic sample helps the company to ensure the quality of their car manufacture is maintained. Testing each vehicle would be costly and take too much time.
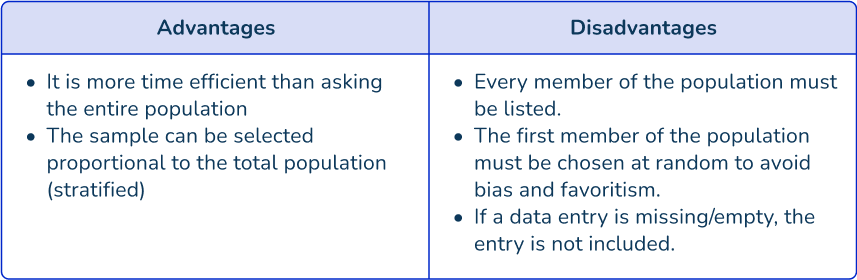
Advantages and disadvantages of systematic sampling
Following a systematic sampling methodology has advantages and disadvantages:
What is systematic sampling?
Common Core State Standards
How does this relate to 7 th grade math and high school math?
- Grade 7 – Statistics and Probability (7.SP.A.1)
Understand that statistics can be used to gain information about a population by examining a sample of the population; generalizations about a population from a sample are valid only if the sample is representative of that population.
Understand that random sampling tends to produce representative samples and support valid inferences.
- High School – Statistics and Probability (HS.S.IC.B.3)
Recognize the purposes of and differences among sample surveys, experiments, and observational studies; explain how randomization relates to each.
- High School – Statistics and Probability (HS.S.IC.B.4)
Use data from a sample survey to estimate a population mean or proportion; develop a margin of error through the use of simulation models for random sampling.
How to take a systematic sample
In order to take a systematic sample:
- Order the population and give each data entry a unique reference number.
- Calculate the number of items of data in the sample.
- Calculate the interval.
- Use a random number generator to select the first item of data.
- Select the remaining items of data following the given sequence.
Systematic sampling examples
Example 1: systematic sampling – production line
A company produces biscuits at 100 per minute. A machine checks the weight of 10 \% of the biscuits.
The biscuits pass through the machine one at a time. Use systematic random sampling to select the biscuits for the sample over 3 minutes.
- Order the population and give each data entry a unique reference number.
As each biscuit passes through the machine one at a time, you can assume that the first biscuit is number 1, the second is biscuit number 2, etc.
2Calculate the number of items of data in the sample.
In 3 minutes, there will be 3 \times 100=300 biscuits. As the company checks 10 \% of the biscuits, you need a sample of:
\cfrac{300}{100}\times{10}=30 biscuits.
3Calculate the interval.
As you need 30 biscuits, and you are using a systematic sample, you need to choose the biscuits using a sequence. You determine the interval in the sequence by dividing the sample size by the population size:
\text{Interval}=\cfrac{\text{Population size}}{\text{Sample size}}=\cfrac{300}{30}=10
So you need to pick every 10 th item in the ordered data set.
4Use a random number generator to select the first item of data.
As you need to pick every 10 th term, the first number in the sample (starting point of the sequence) must be randomly chosen from the first 10 terms.
Using a random number generator, you get the number 6, so you choose the first item of data in the sample to be the 6 th biscuit.
Below you have used a table to show how the sequence develops*:
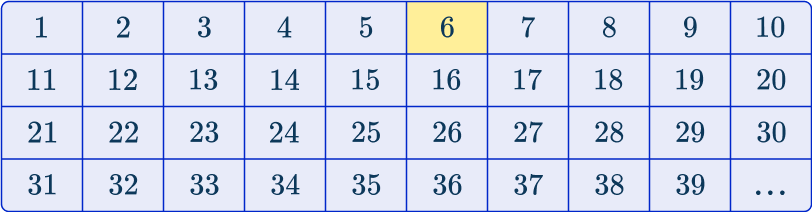
*This table only contains the first 39 biscuits of the 300 in the population.
5Select the remaining items of data following the given sequence.
As you are selecting every 10 th item, you can select the following biscuits from the data:
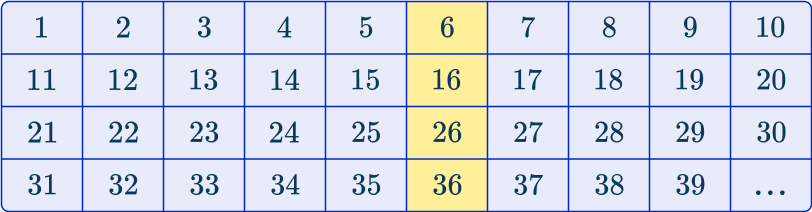
The sample will therefore contain 30 biscuits with the following numbers:
6, \, 16, \, 26, \, 36, \, 46, \, 56, \, 66, \, 76, \, 86, \, 96, \, 106, \, 116,
126, \, 136, \, 146, \, 156, \, 166, \, 176, \, 186, \, 196, \, 206,
216, \, 226, \, 236, \, 246, \, 256, \, 266, \, 276, \, 286, and 296.
Note: These numbers are in the sequence 10n-4.
Example 2: systematic sampling – sample as percentage of population
Luke is looking at the beats per minute of tracks in his music player. He has 1,200 tracks. He decides to take a systematic sample of 25 \% of his tracks. Determine the tracks that should be chosen.
Use the number of plays to sort the data into an order. The first track in the list will be number 1, the second track number 2, etc.
As Luke wants a sample of 25 \%, you need to calculate 25 \% of 1,200\text{:}
\cfrac{1200}{100}\times{25}=300 tracks.
As you need 300 tracks, and you are using a systematic sample, you need to choose the tracks using a sequence. The interval is:
\text{Interval}=\cfrac{\text{Population size}}{\text{Sample size}}=\cfrac{1200}{300}=4
So you need to pick every 4 th term in the data.
As you need to pick every 4 th term, the first number in the sample must be randomly chosen from the first 4 terms.
Using a random number generator, you get the number 1, so you choose the first item of data in the sample to be the 1 st track.
Below you have used a table to show how the sequence develops*:
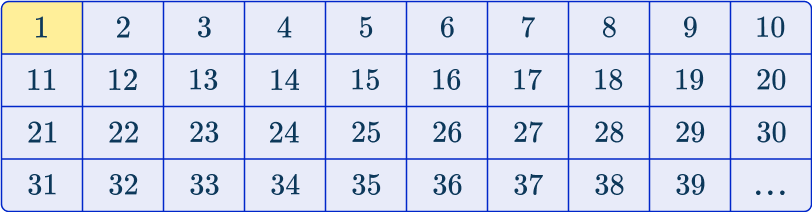
*This table only contains the first 39 tracks of the 1,200 in the population.
As you are selecting every 4 th item, you can select the following tracks from the data:
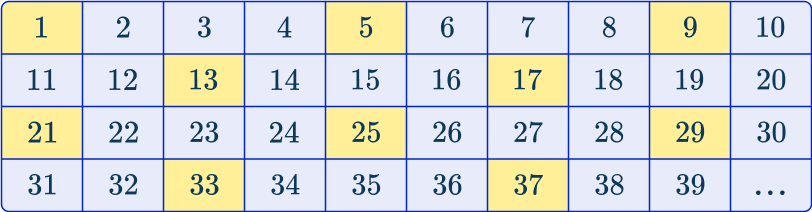
The sample will therefore contain 300 tracks that belong to the sequence 4n-3.
Example 3: systematic sampling – small sample size
A traffic management company is researching the proportion of lorries that use a single carriageway between 8\text{:}00 am and 9\text{:}00 am. A traffic camera records the details of every vehicle and produces a list of data in the order of the time that the vehicle passes the camera.
960 vehicles are recorded within the hour on one day. The company uses a systematic sample to select a random sample of 5 \% of the data for their research. Determine which vehicles will be in the sample.
The population data is in order given their time stamp and so you can list the first vehicle in the list as number 1, second vehicle is number 2, etc.
The sample size is 5 \% so you need to calculate 5 \% of 960\text{:}
\cfrac{960}{100}\times{5}=48 vehicles.
As you need 48 vehicles, the interval is:
\text{Interval}=\cfrac{\text{Population size}}{\text{Sample size}}=\cfrac{960}{48}=20
So you need to pick every 20 th item of data.
As you need to pick every 20 th term, the first number in the sample must be randomly chosen from the first 20 terms.
Using a random number generator, you get the number 17, so you choose the first item of data in the sample to be the 17 th vehicle.
Below you have used a table to show how the sequence develops*:
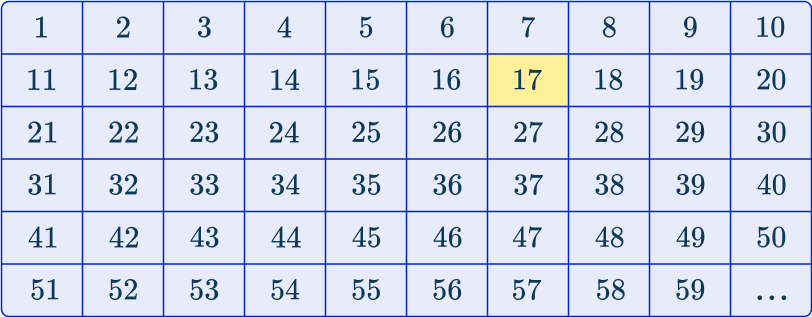
*This table only contains the first 59 vehicles of the 960 in the population.
As you are selecting every 20 th item, you can select the following vehicles from the data:
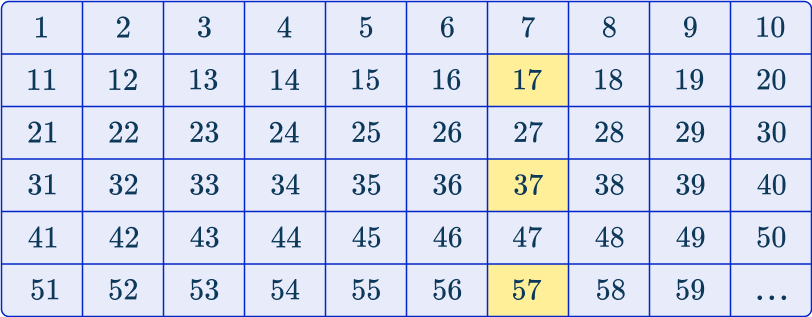
The sample will therefore contain 48 vehicles that belong to the sequence 20n-3.
Example 4: systematic sampling – large population
A local council is researching the distribution of voters in 15,000 homes. They take a systematic sample of 20 \% of homes, listed in order of their zip code and house number. Determine which homes will be asked to participate in the survey.
The population data is in order given their zip code and house number and so you can assume that the first home on the list is number 1, the second home number 2, etc.
The sample size is 20 \% so you need to calculate 20 \% of 15,000\text{:}
\cfrac{15000}{100}\times{20}=300 homes.
As you need 300 homes, and you are using a systematic sample, you need to choose the homes using a sequence. The interval for this set of data is equal to:
\text{Interval}=\cfrac{\text{Population size}}{\text{Sample size}}=\cfrac{15000}{300}=50
So you need to pick every 50 th term in the data.
As you need to pick every 50 th term, the first number in the sample must be randomly chosen from the first 50 terms.
Using a random number generator, you get the number 8, so you choose the first item of data in the sample to be the 8 th home.
Below you have used a table to show how the sequence develops*:
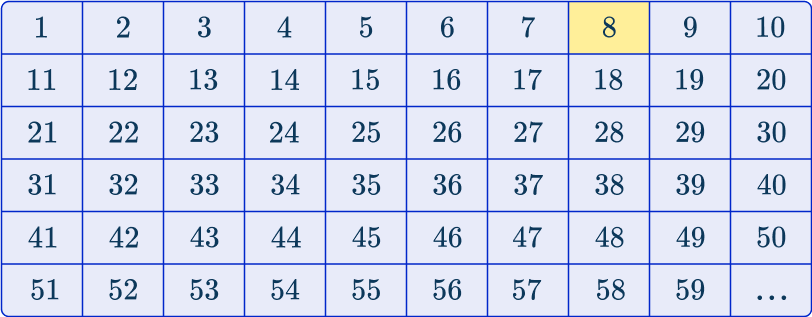
*This table only contains the first 59 homes of the 15,000 in the population.
As you are selecting every 50 th item, you can select the following homes from the data:
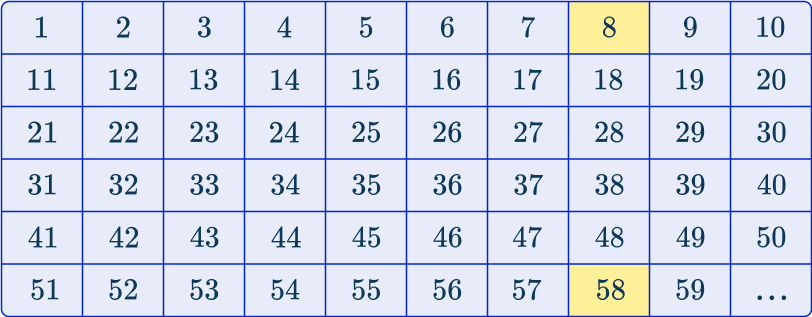
The sample will therefore contain 300 homes that belong to the sequence 50n-42.
Example 5: systematic sampling – small sample
An online clothing company is researching the average customer spend over the previous month. There were 12,664 orders purchased, and each order has a unique reference number.
The company takes a systematic sample of 2 \% of orders. Determine which orders will be chosen for the sample.
As each order has a unique reference number, you can order the numbers from smallest to largest, and then number each item of data from 1-12,664.
As the company is taking a sample of 2 \%, you need to calculate 2 \% of 12,664\text{:}
(12664 \div 100) \times 2=253.28
The sample size is 253 orders.
The interval is equal to
\text{Interval}=\cfrac{\text{Population size}}{\text{Sample size}}=\cfrac{12664}{253}=50\text{ (nearest whole number)}
Using a random number generator, you need to select the first item of data from the first 50 orders. The random number chosen is 13.
The first item of data in the list is the 13 th order.
As the interval is 50, the next order will be 13+50=63, then 63+50=113, then 113+50=163 … and so on until you have selected the 253 items of data.
The sample will therefore contain 253 items of data that belong to the sequence 50n-37.
Example 6: systematic sampling – deciding the population size
A café is carrying out some market research. Out of 1240 customers that entered the café during a weekend, 950 allowed the café to email them a questionnaire.
The café takes a systematic sample size of 12 \% of those who received the questionnaire. Determine which customers will be part of the sample.
Despite there being 1240 customers, the population size is 950 as these customers received a questionnaire.
As they provided an email address, the population can be listed using their email address, in alphabetical order.
The café is taking a sample size of 12 \%.
(950 \div 100) \times 12=114
The sample will contain 114 items of data.
The interval is
\text{Interval}=\cfrac{\text{Population size}}{\text{Sample size}}=\cfrac{950}{114}=8\text{ (nearest whole number)}
As every 8 th customer is being selected, the first customer must be randomly chosen from the first 8 items of data. Using a random number generator, the 4 th customer is chosen.
As the first customer is number 4, and every 8 th customer is being selected after, you continue to add 8 to the previous value in the sequence until you have selected the 114 customers (items of data).
This follows the sequence 8n-4.
Teaching tips for systematic sampling
- Make sure students understand the systematic sampling definition and how it differs from other methods of sampling like simple random sampling and stratified sampling. This understanding will help them grasp when and why each method is used in research and data collection.
- Provide worked examples showing different scenarios, such as different population sizes and sampling intervals.
- Discuss real-world applications where systematic sampling is used, such as in market research or quality control in manufacturing.
- Teach students strategies to minimize sampling errors, such as ensuring a random starting point, verifying the completeness of the population list, and considering alternative sampling methods when systematic biases are suspected.
Easy mistakes to make
- Mixing up a sampling method
Using the incorrect sampling process to select data (such as using systematic sampling or non-random sampling).
- Ignoring random start
Forgetting to randomly select the starting point can introduce bias if there’s any hidden pattern in the list.
- Data not in order
When you are finding the median value in a set of data, the data must be in order, otherwise the number being picked is not the median, it’s just the middle number in a random list. This is the same for a systematic sample.
Every item of data is structured in an order from a sampling frame (age, zip code, alphabetical order etc), and then your sample is taken.
- Incorrectly calculating the interval for the sample
Let’s assume you have 1,000 items of data. 5 \% of 1,000 is 50 so you need 50 items of data.
Those 50 items of data must be spread equally across all of the ordered data, so by dividing the number in the population by the sample size, you find the interval between each item of data.
Here you would have \cfrac{1000}{50}=20. You would choose every 20 th item in the list of 1,000 items to get a sample of 50.
Related sampling methods lessons
Practice systematic sampling questions
1. The total items of data in a list is equal to 1350. Describe how you would take a systematic sample of 20 \% of the population.
Order and number the items in the list. Find 20 \% of the total population. Calculate the interval. Select the first number using a random number generator. Select every 5 th item in the list afterward.

Split the total population into smaller categories. Calculate 20 \% of each category. Use a random number generator to select items in each category, proportional to the total.

Order the population and assign each item of data a unique number. Use a random number generator to select every 20 th item in the list.
Select the first 20 \% of items of data in the list.
For a sample of 20 \%, you need to calculate 20 \% of the population. Here, 20 \% of 1350 is 270, so you need 270 listed items.
As the sampling technique is systematic, you need to calculate the interval (the sequence) for which the items in the list will be selected.
Here, as you want 20 \% of the population, this is equivalent to every fifth item of data in the list (20 \%=\cfrac{20}{100}=\cfrac{1}{5}).
To determine which item in the list is first, you need to use a random number generator to select one of the first five items in the list only. Here, a random number generator selected the first item in the list to be the 3 rd item listed.
So, by starting at the randomly selected 3 rd item in the ordered population list, and selecting every 5 th item in the population as you want a sample size of 20 \% \; (270 items), you generate a systematic sample.
2. A company wants to survey 25 \% of its staff members. The company has 36 employees which are listed in alphabetical order by their last names. If the first member in the list chosen is number 3, what other members will be chosen for a systematic sample?
12, \, 21, and 30
4, \ 8, \, 12, \, 16, \, 20, \, 24, \, 28, and 32
7, \, 11, \, 15, \, 19, \, 23, \, 27, \, 31 and 35
4, \, 5, \, 6, \, 7, \, 8, \, 9, \, 10, and 11
25 \% of 36=9 so the sample size contains 9 members of staff.
\cfrac{9}{36}=\cfrac{1}{4} so every 4 th person is chosen after person 3.
3. A field is divided into equal-sized squares. Each square is ordered from 1-120. The farmer would like to study the amount of weeds in the crop so he takes a systematic sample of 5 \% of the population.
Given that the final number in the list is square 118, determine the number of the first square in the sample.
5 \% of 120=6 items of data
\cfrac{120}{6}=20 so every 20 th item of data is chosen
118\div{20}=5.9 so you can subtract 20 from 118 five times, leaving us with the number 18 as the first in the list.
4. Jodie records the number of steps she takes per day over 30 days. She wants to take a sample of data to find out how she has progressed over the month. She decides to take a systematic sample of half of the data.
The first item of data is randomly chosen as day 1. What day of the week is the last item of data in the sample? Use the table below to help you.

Tuesday
Saturday
Thursday
Monday
Half of the data means every other day, which gives us every odd number in the month. The last odd number in the month is 29, which is a Monday.
5. A school contains 2,243 students. A research group takes a systematic sample of 16 \% of students. They order the subset in order of the student’s age.
If the first student randomly selected from the list is number 3, determine the nth term of the sequence that selects the remaining sample of students.
The first number in the sequence is 3.
The number of students in the sample is 16 \% of 2,243, which is equal to:
(2243\div{100})\times{16}=359\text{ (nearest whole)}
The interval is equal to
\text{Interval}=\cfrac{\text{Population size}}{\text{Sample size}}=\cfrac{2243}{359}=6\text{ (nearest whole number)}
The first 5 terms in the sequence are therefore: 3, \, 9, \, 15, \, 21, \, 27, \, …
The common difference in the sequence is +6, so you have the sequence 6n.
The first term in the sequence 6n is 6\times{1}=6. You need the first term to equal 3, so you have to subtract 3 from 6n, giving us the nth term 6n-3.
6. A hotel has 18 floors. Each floor has 4 apartments, except for the ground floor which has 2 apartments, and the top floor which is one single apartment.
Each apartment is given a unique reference number according to the floor level and the apartment number (for example, apartment 2 on floor 16 is number 162 ).
A hotel inspector is required to inspect 4 \% of apartments, chosen using a systematic sample. The first apartment that is inspected is randomly selected to be number 012.
This is the 4 th apartment in the list. What is the number of the last apartment to be inspected?
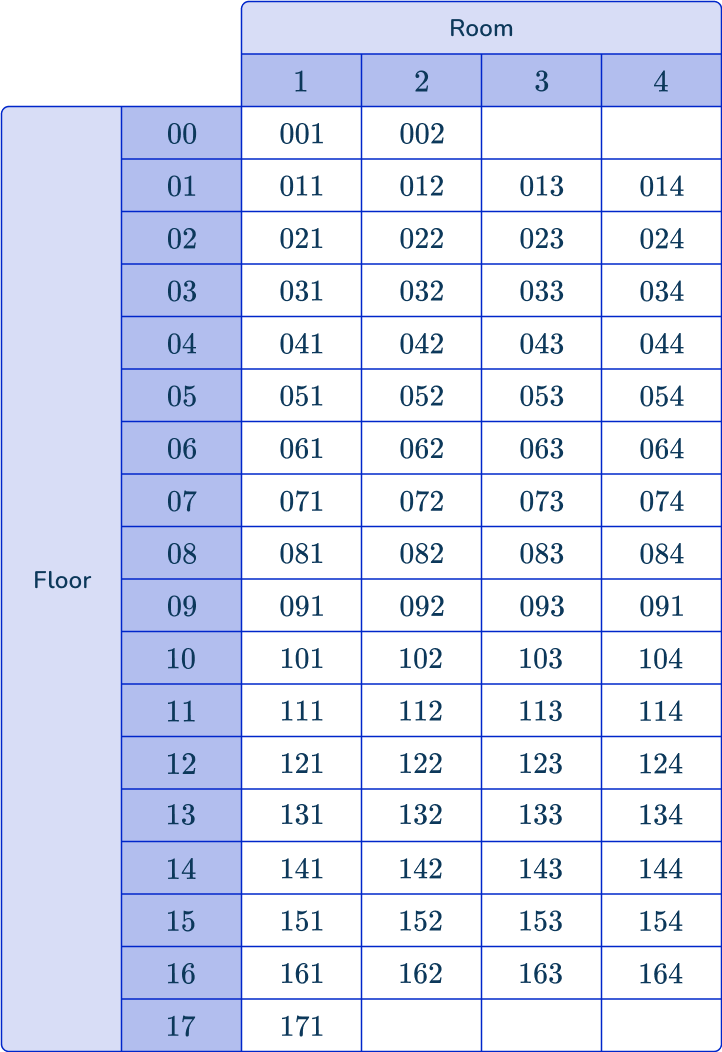
There are 16 floors with 4 apartments (116\times{4}=64).
There is 1 floor with 2 apartments (1\times{2}=2).
There is 1 floor with 1 apartment (1). Adding these together, you have the total number of apartments to be 64+2+1=67.
You need a sample of 4 \% of 67\text{:}
(67\div{100})\times{4}=3 (to the nearest whole number) rooms.
The interval is equal to
\text{Interval}=\cfrac{\text{Population size}}{\text{Sample size}}=\cfrac{67}{3}=22\text{ (to the nearest whole number)}
The positions of the 3 rooms in the list are:
012 – the 4 th apartment in the list (this was given)
4+22=26 th apartment in the list (number 064 )
26+22=48 th apartment in the list (number 162 )
The last room that will be inspected is apartment 2 on floor 16.
Systematic sampling FAQs
Systematic sampling is a probability sampling method where every nth element from a complete list is selected after a random starting point. This method is efficient and straightforward, often considered to have a low risk of data manipulation by statisticians.
The different types of systematic sampling are linear systematic sampling, circular systematic sampling, and stratified systematic sampling.
Systematic sampling selects every nth item after a random start, while simple random sampling selects items entirely by chance. Systematic sampling is generally more efficient and easier to implement than simple random sampling.
Use systematic sampling when the target population is homogeneous and elements are evenly distributed, you have a complete and accurate list of the population, and there are no periodic patterns in the population list that could bias the sample.
For instance, systematic sampling is suitable for selecting every 10 th patient from a hospital database for a satisfaction survey.
Systematic sampling selects every nth item from a complete list after a random start, ensuring uniform coverage.
Cluster sampling divides the population into clusters, randomly selects some clusters, and then includes all elements or a random sample from the chosen clusters, making it useful for geographically dispersed populations.
The next lessons are
Still stuck?
At Third Space Learning, we specialize in helping teachers and school leaders to provide personalized math support for more of their students through high-quality, online one-on-one math tutoring delivered by subject experts.
Each week, our tutors support thousands of students who are at risk of not meeting their grade-level expectations, and help accelerate their progress and boost their confidence.

Find out how we can help your students achieve success with our math tutoring programs.
[FREE] Common Core Practice Tests (3rd to 8th Grade)
Prepare for math tests in your state with these 3rd Grade to 8th Grade practice assessments for Common Core and state equivalents.
Get your 6 multiple choice practice tests with detailed answers to support test prep, created by US math teachers for US math teachers!