High Impact Tutoring Built By Math Experts
Personalized standards-aligned one-on-one math tutoring for schools and districts
In order to access this I need to be confident with:
Input output tables Graphing linear equations How to factor a quadratic equationGraphing quadratic functions
Here you will learn about plotting quadratic graphs including how to create a table of values and how to identify key features of quadratic functions to help with graphing them.
Students first learn about quadratic functions in Algebra I and expand their knowledge of quadratics and polynomial functions as they progress through Algebra II and Precalculus.
What is graphing quadratic functions?
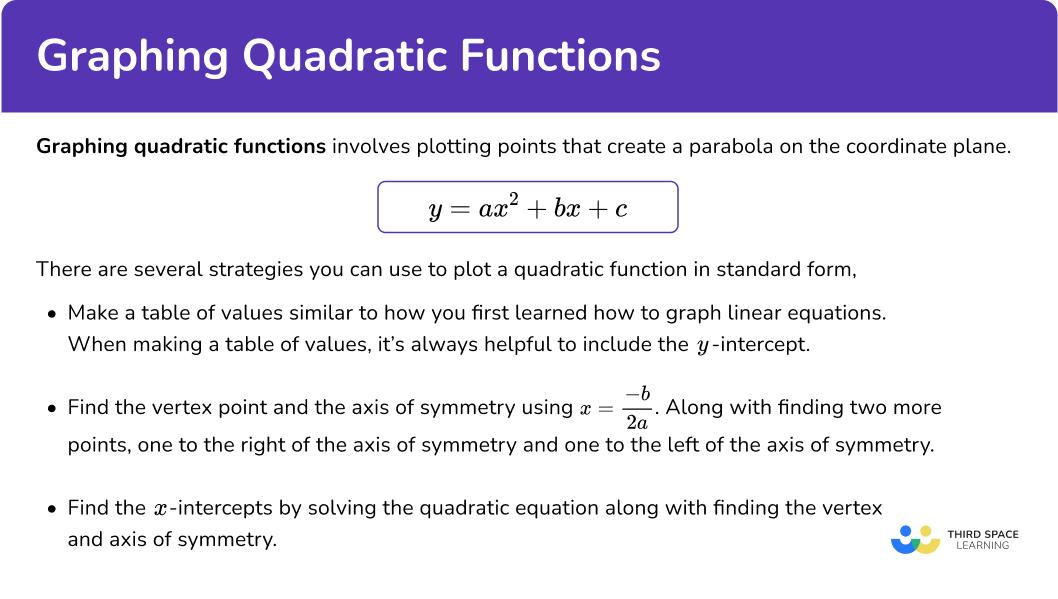
Graphing quadratic functions involves plotting points that create a parabola on the coordinate plane.
There are several strategies you can use to plot a quadratic function in standard form, y=a x^2+b x+c.
![[FREE] Graphing Quadratic Functions Worksheet (High School)](https://thirdspacelearning.com/wp-content/uploads/2024/12/Graphing-Quadratic-Functions-Worksheet-listing-image.png)
[FREE] Graphing Quadratic Functions Worksheet (High School)
Use this worksheet to check your high school students’ understanding of graphing quadratic functions. 15 questions with answers to identify areas of strength and support!
DOWNLOAD FREE [FREE] Graphing Quadratic Functions Worksheet (High School)
Use this worksheet to check your high school students’ understanding of graphing quadratic functions. 15 questions with answers to identify areas of strength and support!
DOWNLOAD FREECreating a table of values
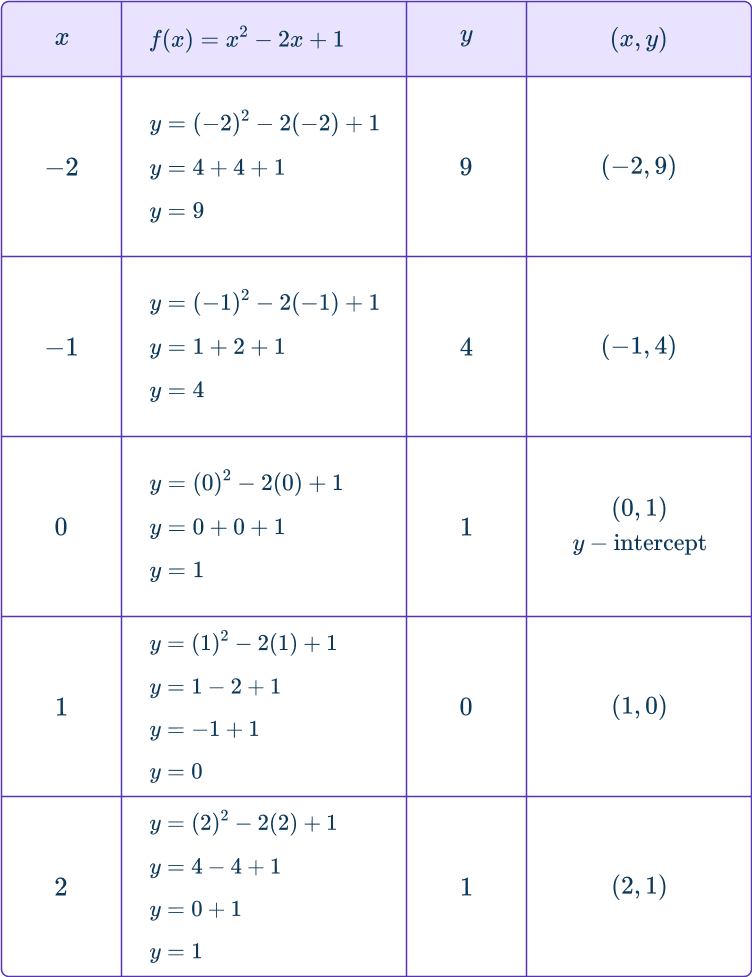
Similar to how you created a table of values to graph linear functions, you can use the same strategy to graph a quadratic function. Let’s create a table of values to graph the function,
f(x)=x^2-2 x+1Since x is the independent variable, select any values you want. Typically, select values that are easy to calculate, such as - \, 2, - \, 1, \, 0, \, 1, \, 2.
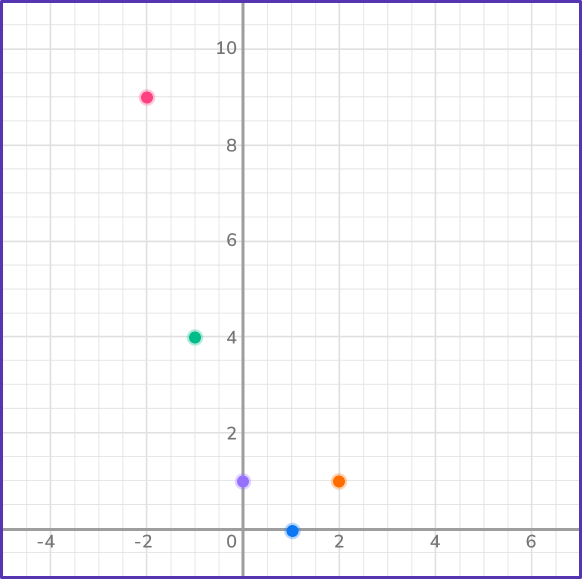
Once you have completed the table of values, take each of the points and plot them on the coordinate plane.
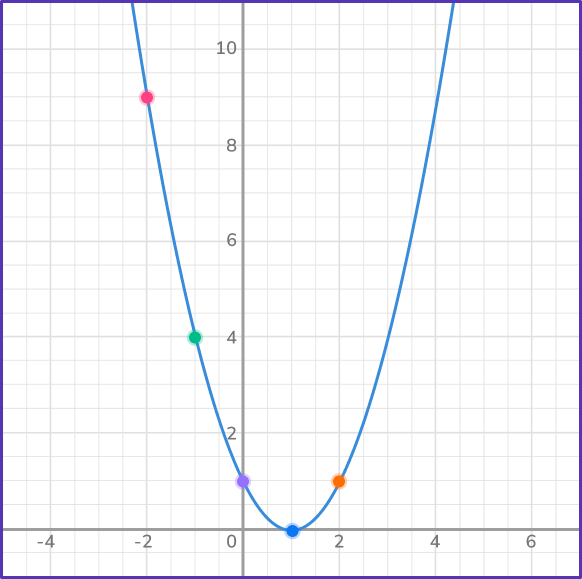
After you plot the points, draw a smooth u -shaped parabola through the points.
Let’s look at another example,
f(x)=x^2+2 x+5Select values for x, good values to use are - \, 2, \, - \, 1, \, 0, \, 1, \, 2.
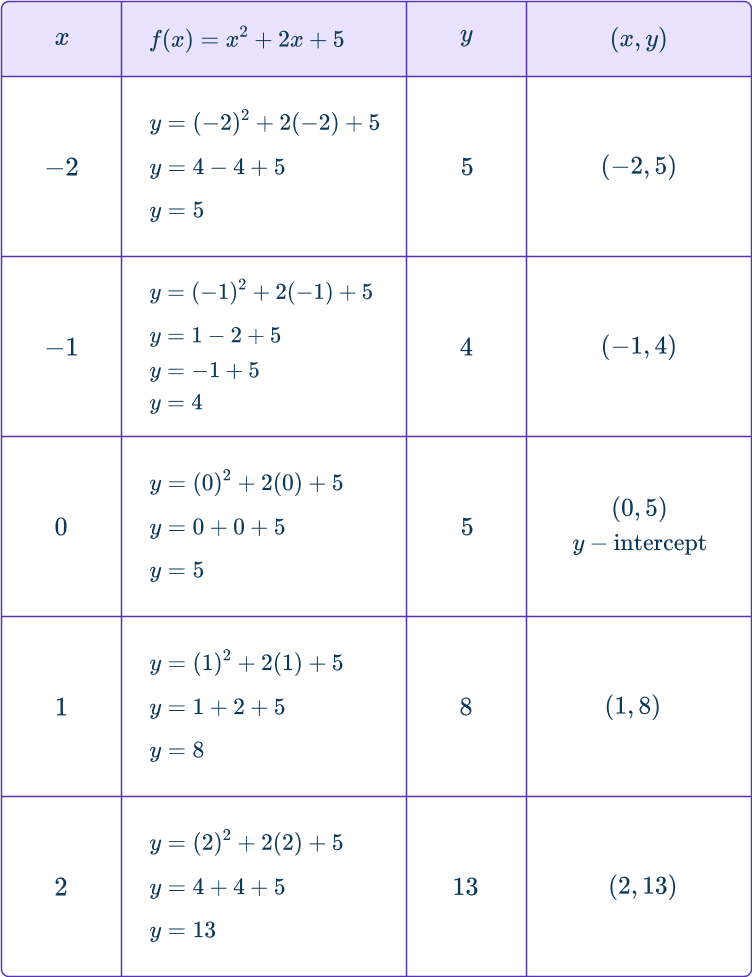
When x=0, the point is the y -intercept which is the point where the graph of the function intersects the y -axis.
Once you have completed the table of values, take each of the points and plot them on the coordinate plane.
Then after you plot the points, draw a smooth u -shaped parabola through the points.
Using the vertex and axis of symmetry
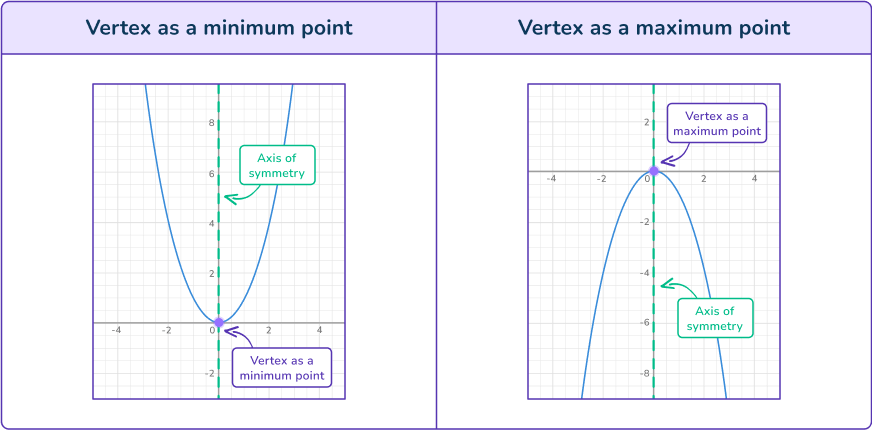
Another strategy you can use to graph a quadratic function in standard form is to find the vertex point and axis of symmetry. The vertex of a quadratic function is either the minimum point (when the a value is positive) or the maximum point (when the a value is negative) of a parabola.
The axis of symmetry is the vertical line of symmetry of the parabola. This strategy can be used when the quadratic equation is in standard form.
However, it is very useful when the quadratic equation is in vertex form, which is y=a(x-h)^{2}+k, where (h, \, k) is the vertex and x=h is the axis of symmetry.
Let’s graph the quadratic equation, y=- \, (x-6)^2+8 using the vertex point and axis.
In this case, the quadratic equation is in vertex form, so identify the value of h and the value of k.
\begin{aligned}h&=6 \\\\ k&=8 \end{aligned}The vertex is the point, (6, \, 8) and the axis of symmetry is x=6.
The value of a is - \, 1 , so the parabola will be upside down because a is negative.
In order to sketch the quadratic function, find two more points.
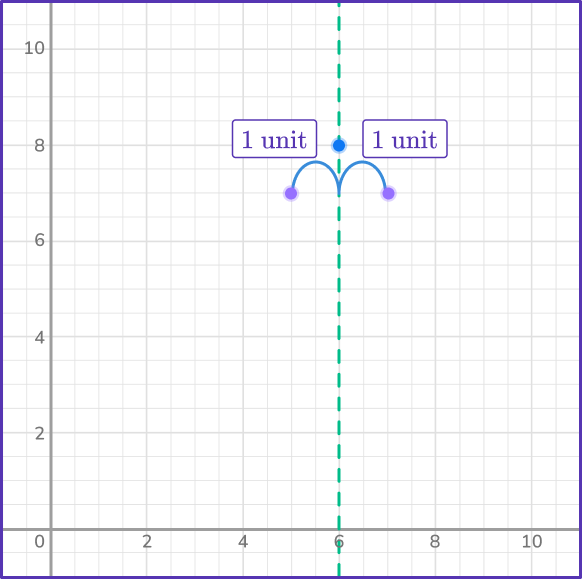
Select an x value to the right of the axis of symmetry and to the left of the axis of symmetry. The x values have to be the same number of units to the right and left.
Quadratics are symmetric, so the points are symmetrical.
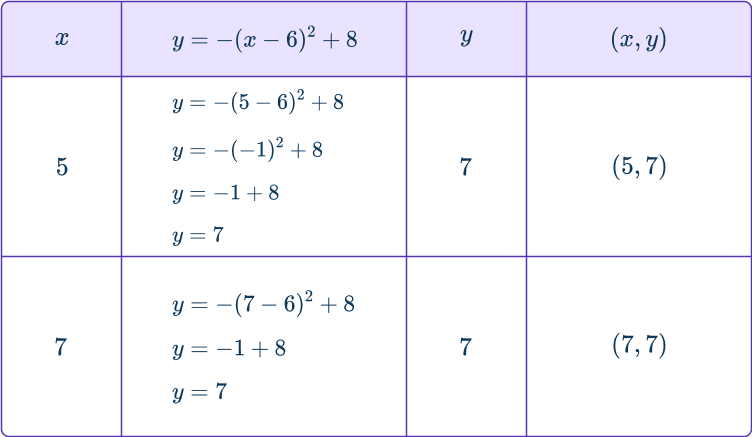
Select x values of 5 and 7 (both are 1 unit to the left and right of the axis of symmetry). The y -coordinates should be the same value.
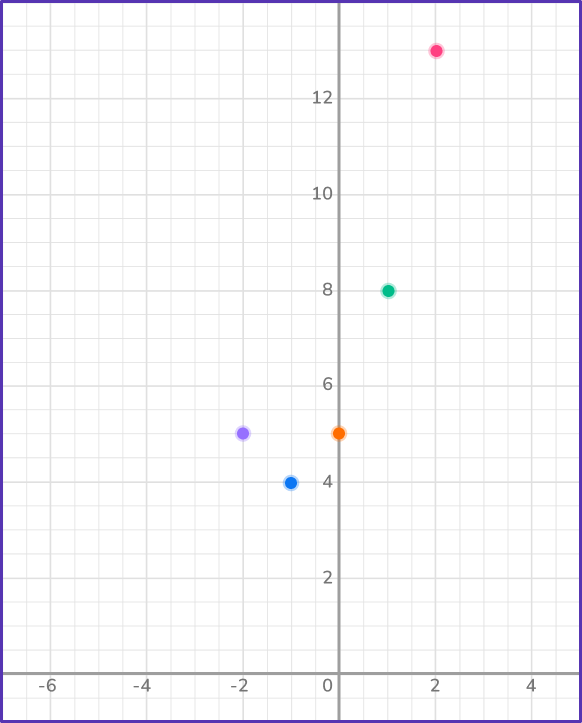
Plot the axis of symmetry, the vertex and the two points on the coordinate plane.
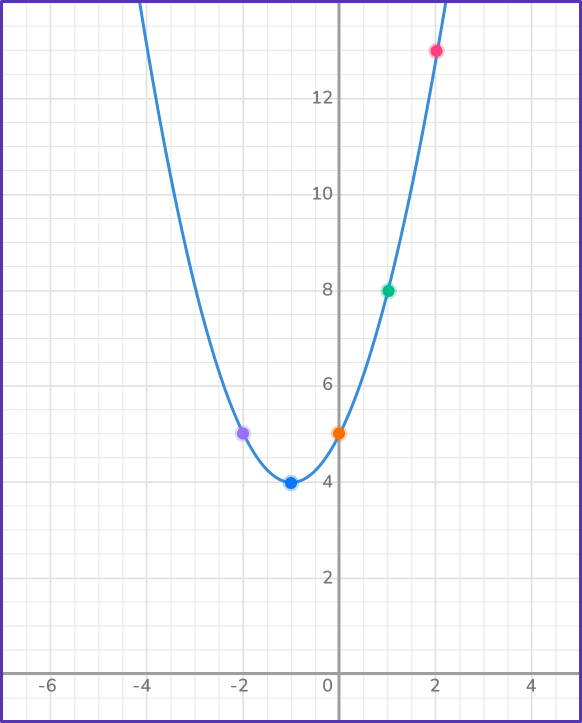
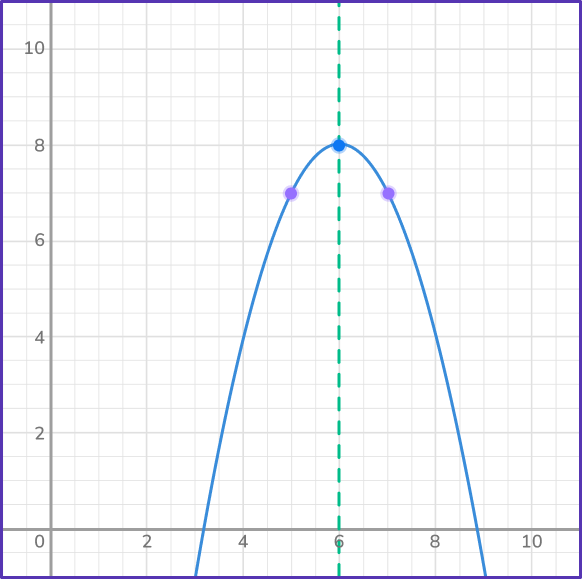
Draw the parabola.
Using the x -intercepts and vertex
Another strategy you can use to graph a quadratic function in standard form is to factor the quadratic to find the x -intercepts. The x -intercepts are the solutions to the quadratic equation and the point(s) where the parabola crosses or touches the x -axis.
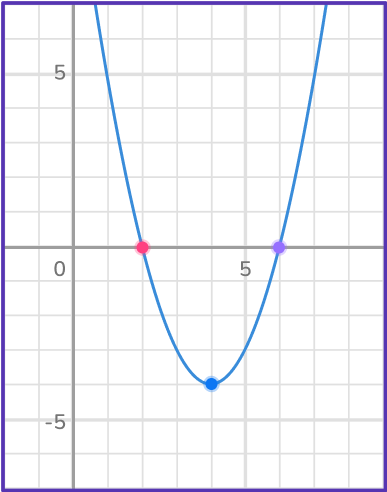
For example, let’s graph the quadratic function, y=x^2+2 x-15 by finding the x -intercepts.
Since the x -intercepts are the solutions of a quadratic equation, first solve the quadratic equation for x by factoring.
*Remember to set the quadratic equation equal to 0 before solving.
\begin{aligned}& x^2+2 x-15=0 \\\\ & (x+5)(x-3)=0 \\\\ & x+5=0 \quad \quad \; x-3=0 \\\\ & x=- \, 5 \quad \quad \quad x=3 \end{aligned}The solutions are x=- \, 5 and x=3 which means that the x -intercepts are x=- \, 5 and x=3. You can write the x intercepts as points.
(3, \, 0) and (- \, 5, \, 0)
Next, find the vertex by finding the x value using, x=\cfrac{- \, b}{2 a} but first identify a, \, b, \, c, which in this case is, a=1, \, b=2, \, c=- \, 15. Substitute those values into the formula to find x.
\begin{aligned}& x=\cfrac{- \, (2)}{2(1)}=- \, 1 \\\\ & x=- \, 1 \end{aligned}The x -coordinate is - \, 1, find the y coordinate by substituting the x value into the original equation.
\begin{aligned}& y=x^2+2 x-15 \\\\ & y=(- \, 1)^2+2(- \, 1)-15 \\\\ & y=1-2-15 \\\\ & y=- \, 16 \end{aligned}The vertex of the quadratic is (- \, 1, \, - \, 16)
Remember, the axis of symmetry is the same as the x -coordinate, so in this case the axis of symmetry is x=- \, 1.
Plot the x -intercepts and the vertex on the coordinate plane.
Then draw a smooth curve, the parabola, through the points.
What is graphing quadratic functions?
Common Core State Standards
How does this apply to high school math?
- High School Functions-Interpreting Functions (HSF-IF.C.7a)
Graph linear and quadratic functions and show intercepts, maxima, and minima.
How to graph quadratic functions
In order to graph a quadratic function using a table of values:
- Create a table of values to calculate \textbf{x} values and matching \textbf{y} values.
- Plot the points on the coordinate plane.
- Join the points with a smooth curve.
Graphing quadratic functions examples
Example 1: the standard quadratic graph
Graph the quadratic function by creating a table of values.
y=x^2-3- Create a table of values to calculate \textbf{x} values and matching \textbf{y} values.
Select x values of - \, 2, \, - \, 1, \, 0, \, 1, \, 2 .
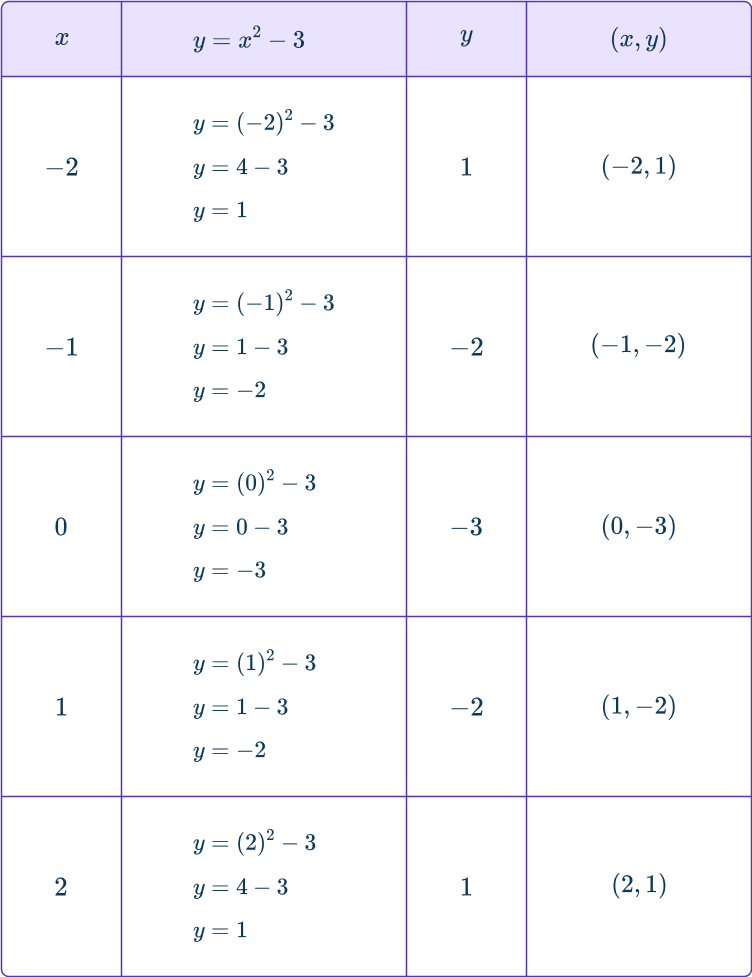
When the x value is 0, the point is the y -intercept which is the point where the graph of the function intersects the y -axis.
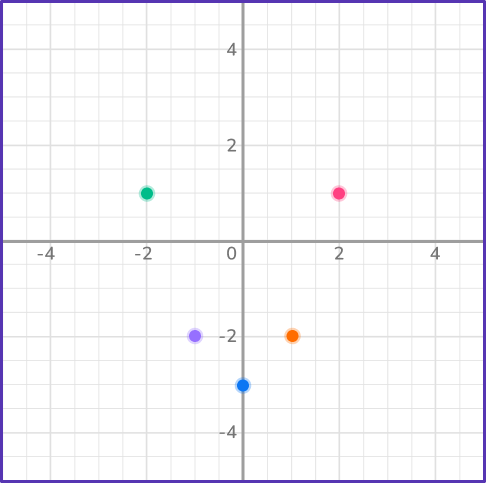
2Plot the points on the coordinate plane.
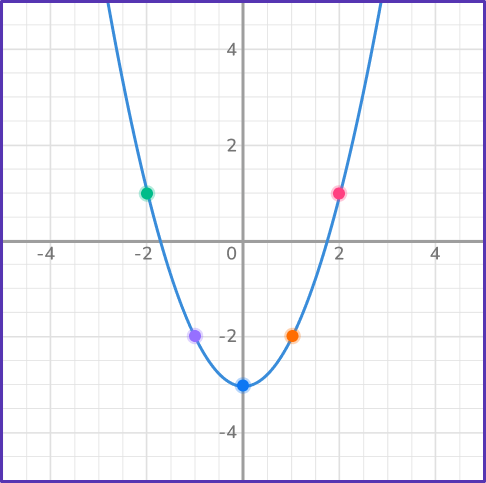
3Join the points with a smooth curve.
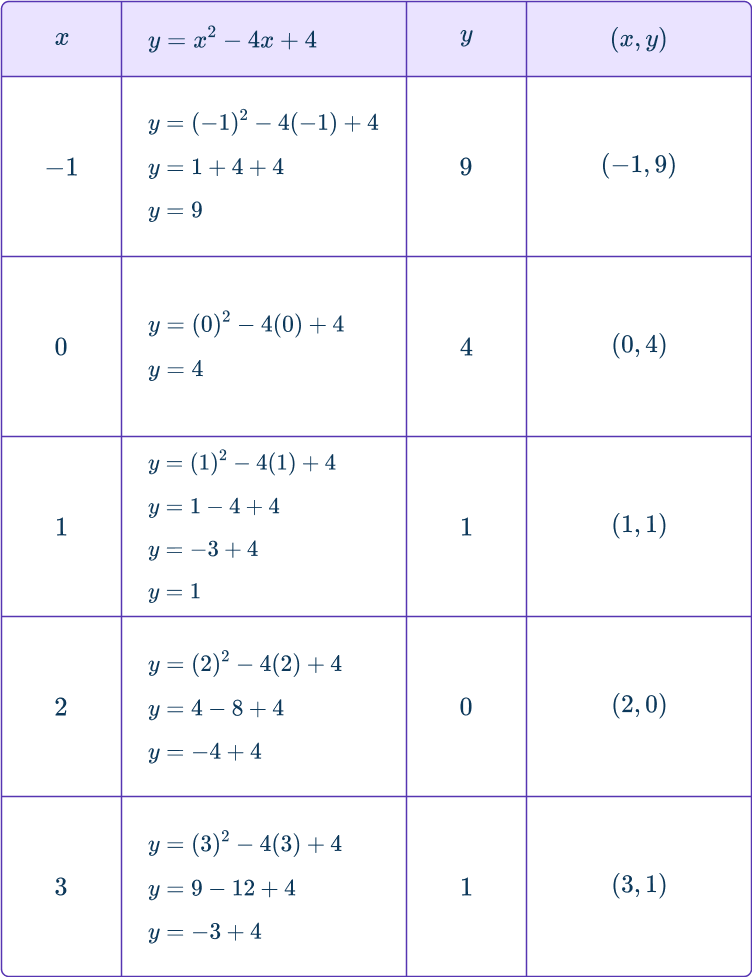
Example 2: the standard quadratic graph
Graph the quadratic function by creating a table of values.
y=x^{2}-4x+4Create a table of values to calculate \textbf{x} values and matching \textbf{y} values.
In this case, select x values of - \, 1, \, 0, \, 1, \, 2, \, 3.
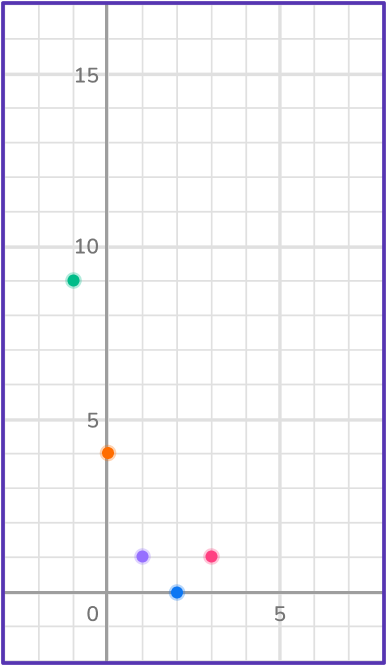
Plot the points on the coordinate plane.
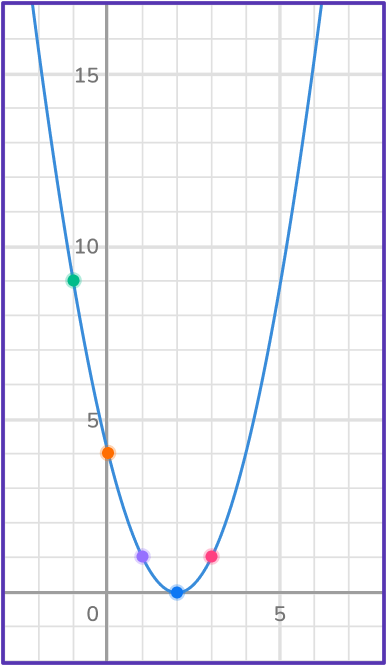
Join the points with a smooth curve.
How to graph quadratic functions
In order to graph a quadratic function using the vertex and axis of symmetry:
- Find the vertex point and axis of symmetry.
- Find a point to the left and to the right of the axis of symmetry.
- Plot the points and the vertex on the coordinate plane.
- Join the points with a smooth curve.
Example 3: vertex and axis of symmetry
Graph the quadratic function using the axis of symmetry and the vertex point.
y=- \, x^2-8 x-19Find the vertex point and the axis of symmetry.
The axis of symmetry is a vertical line that divides the parabola into two identical parts. In order to use, x=\cfrac{- \, b}{2 a}, identify a, \, b, \, c.
In this case a=-1, \, b=-8 and c=-19
Substitute the values for a, \, b, \, c into the formula to find the axis of symmetry.
\begin{aligned}& x=\cfrac{- \, (- \, 8)}{2(- \, 1)}=\cfrac{8}{- \, 2}=- \, 4 \\\\ & x=- \, 4 \end{aligned}
The axis of symmetry is x=- \, 4.
The x coordinate of the vertex point is the same as the axis of symmetry, x=4.
To find the y coordinate, substitute the value of x into the original function and calculate y.
\begin{aligned}& y=- \, x^2-8 x-19 \\\\
& y=- \, (- \, 4)^2-8(- \, 4)-19 \\\\
& y=- \, 16+32-19 \\\\
& y=- \, 3 \end{aligned}
The vertex point is (- \, 4, \, - \, 3).
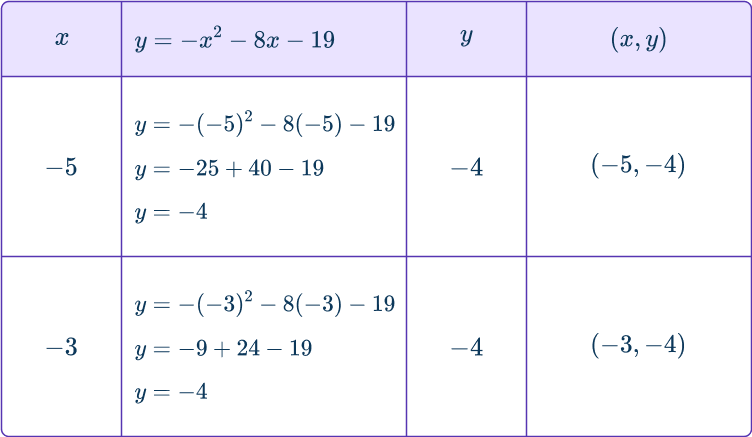
Find a point to the left and to the right of the axis of symmetry.
Since the parabola is symmetric, select an x value one unit from the left and right of the axis of symmetry. In this case, select x=- \, 5 and x=- \, 3. Calculate the y -coordinates.
Plot the vertex, axis of symmetry, and points on the coordinate plane.
Join the points with a smooth curve.
Example 4: vertex form
Find the graph of the function, y=(x-3)^2-4.
Find the vertex point and axis of symmetry.
The quadratic is in vertex form and the vertex point is (h, \, k). In this case,
\begin{aligned}& h=3 \\\\
& k=- \, 4 \end{aligned}
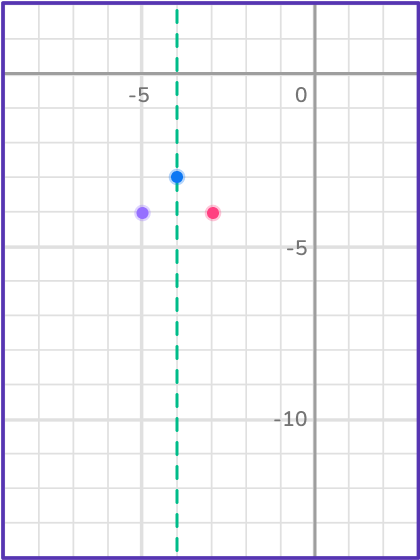
So, the axis of symmetry is x=3 and the vertex is (3, \, - \, 4).
Find a point to the left and to the right of the axis of symmetry.
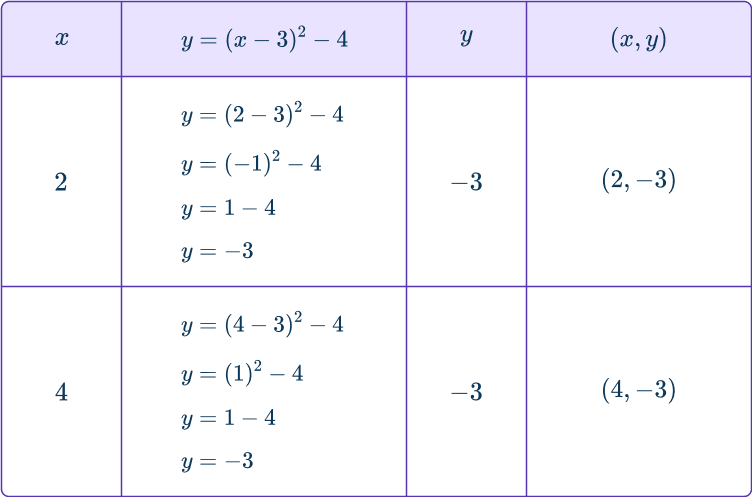
The parabola is symmetrical so select a point one unit to the right and left of the axis of symmetry. In this case, select x=2 and x=4.
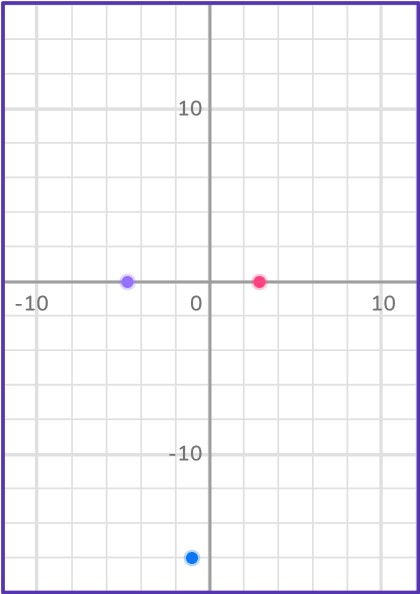
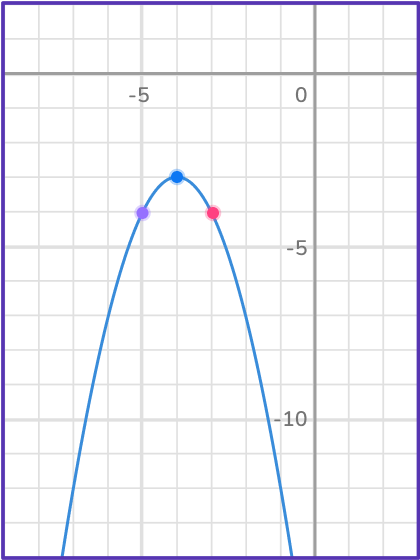
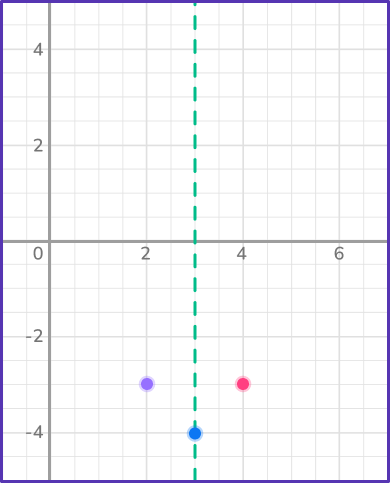
Plot the vertex, axis of symmetry, and points on the coordinate plane.
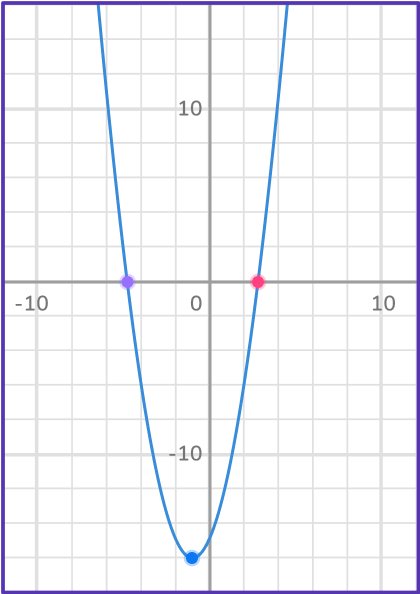
Join the points with a smooth curve.
How to graph quadratic functions
In order to graph a quadratic function using the x -intercepts and vertex:
- Set the quadratic equation equal to \bf{0}.
- Solve the quadratic by factoring.
- Find the vertex point and axis of symmetry.
- Plot the \textbf{x} -intercepts and the vertex on the coordinate plane.
- Draw a smooth curve through the points.
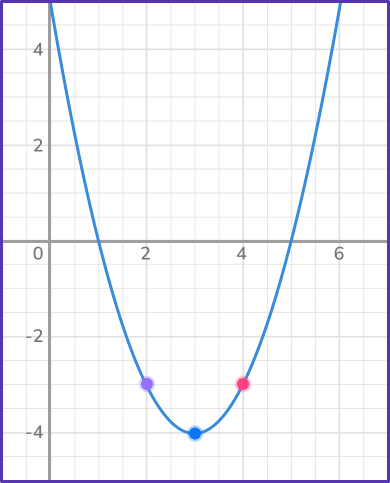
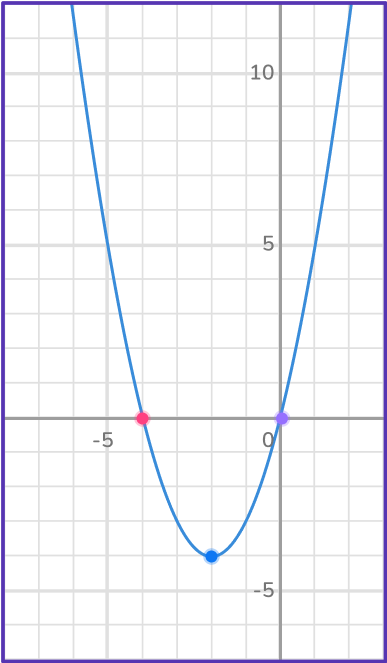
Example 5: vertex and x -intercepts
Graph the quadratic function by finding the x -intercepts and the vertex.
y=x^2+2 x-3Set the quadratic equation equal to \bf{0}.
Solve the quadratic by factoring.
Find the vertex point and axis of symmetry.
To find the vertex, use the formula, x=\cfrac{- \, b}{2a} but first identify a, \, b, \, c which in this case is a=1, \, b=2, \, c=- \, 3. Substitute those values into the formula, x=\cfrac{- \, b}{2 a}.
\begin{aligned}& x=\cfrac{- \, 2}{2(1)}=- \, 1 \\\\
& x=- \, 1 \end{aligned}
The x coordinate of the vertex is - \, 1. To find the y -coordinate, substitute the value into the original equation.
\begin{aligned}& y=(- \, 1)^2+2(- \, 1)-3 \\\\
& y=1-2-3 \\\\
& y=- \, 4 \end{aligned}
The vertex is (- \, 1, \, - \, 4) and the axis of symmetry is x=- \, 1.
Plot the \textbf{x} -intercepts and the vertex on the coordinate plane.
Plot the the x -intercepts (3, \, 0) and (1, \, 0) and the vertex (- \, 1, \, - \, 4).
Draw a smooth curve through the points.
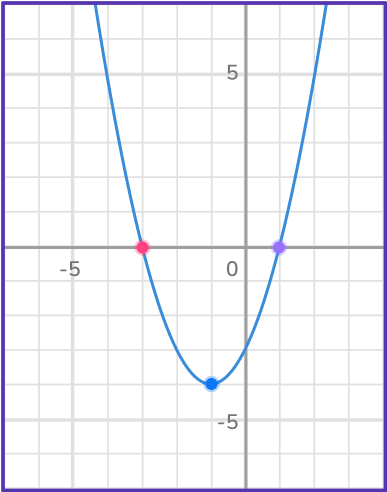
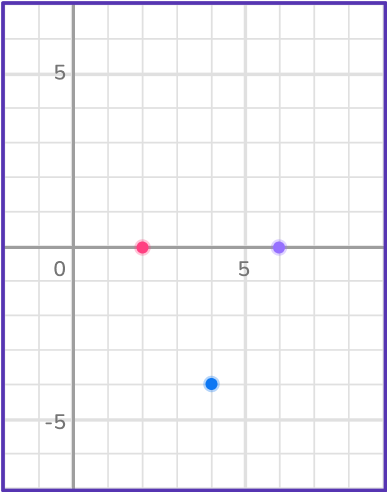
Example 6: vertex and x -intercepts
Graph the quadratic function by finding the x -intercepts and the vertex.
y=x^2-8 x+12Set the quadratic equation equal to \bf{0}.
Solve the quadratic by factoring.
Find the vertex point and axis of symmetry.
To find the vertex, use the formula, x=\cfrac{- \, b}{2 a} but first identify a, \, b, \, c which in this case is a=1, \, b=- \, 8, \, c=12. Substitute those values into the formula, x=\cfrac{- \, b}{2 a}.
\begin{aligned}& x=\cfrac{- \, (- \, 8)}{2(1)}=\cfrac{8}{2}=4 \\\\
& x=4 \end{aligned}
The x coordinate of the vertex is 4. To find the y -coordinate, substitute the x value into the original equation.
\begin{aligned}& y=(4)^2-8(4)+12 \\\\
& y=16-32+12 \\\\
& y=- \, 4 \end{aligned}
The vertex is (4, \, - \, 4) and the axis of symmetry is x=4.
Plot the \textbf{x} -intercepts and the vertex on the coordinate plane.
Plot the x -intercepts, (6, \, 0) and (2, \, 0) and the vertex (4, \, - \, 4).
Draw a smooth curve through the points.
Teaching tips for graphing quadratic functions
- Have students work in collaborative groups with chart paper to investigate key components of quadratic graphs by first having them create tables of values.
- Incorporate active learning activities such as gallery walks or jigsaw learning groups so that students have the opportunity to have math discourse and discuss the mathematical concepts.
- Instead of worksheets to have students practice problems, have them engage in game playing by using digital platforms such as Blooket or Gimkit.
- Demonstrate to students how to use digital platforms such as Desmos or graphing calculators when graphing quadratic equations.
- Incorporate word problems so that students can understand how quadratic functions relate to the real world.
Easy mistakes to make
- Making calculation errors
For example, for the quadratic function y=- \, x^2-3, when substituting in x=3, thinking that the calculation is:
\begin{aligned}& y=- \, 3^2-3 \\\\ & y=9-3 \\\\ & y=6 \quad ❌ \end{aligned}
The calculation should be:
\begin{aligned}& y=- \, x^2-3 \\\\ & y=- \, 3^2-3 \\\\ & y=- \, 9-3 \\\\ & y=- \, 12 \quad ✅ \end{aligned}
- Forgetting that when the \textbf{“a”} value is negative the parabola is upside down
For example, when graphing the quadratic, y=- \, x^2+2 thinking that it should be sketched as: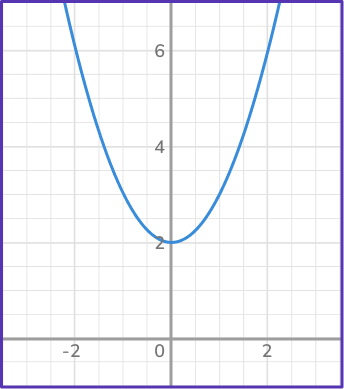
However, it should be sketched as: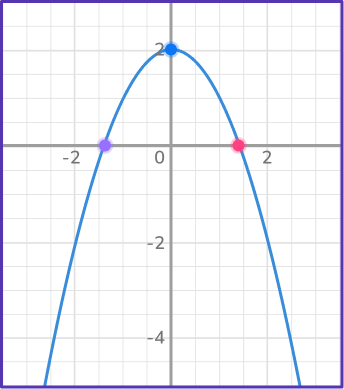
- Forgetting that the \textbf{b} is negative when finding the axis of symmetry
When solving for the axis of symmetry, the formula to use is x=\cfrac{- \, b}{2 a} NOT
x=\cfrac{b}{2 a}.
So, when finding the axis of symmetry for a quadratic equation such
as 2 x^2-6 x+3, \, a=2, \, b=- \, 6 and c=3, which means when you
substitute the values in do not do this:
x=\cfrac{- \, 6}{2(2)}=\cfrac{- \, 6}{4}=- \, \cfrac{3}{2} \quad ❌
Instead, remember that the numerator is negative so,
x=\cfrac{- \, (- \, 6)}{2(2)}=\cfrac{6}{4}=\cfrac{3}{2} \quad ✅
Practice graphing quadratic functions questions
1. Select the correct graph of the quadratic function:
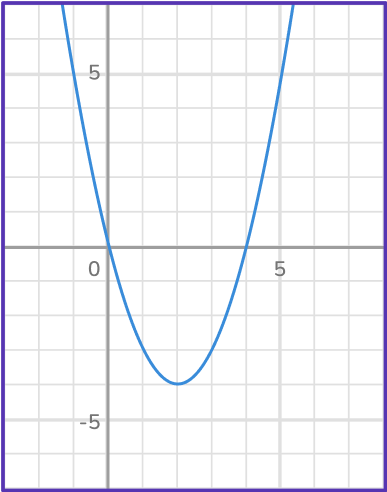
y=x^{2}+4
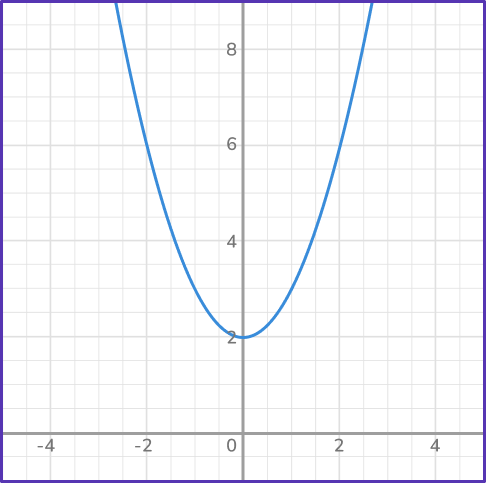

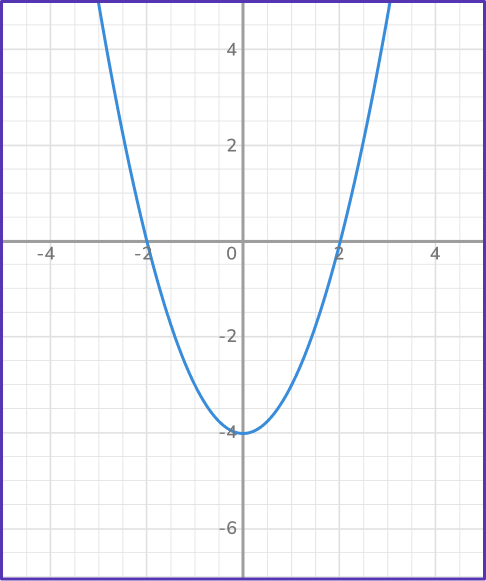
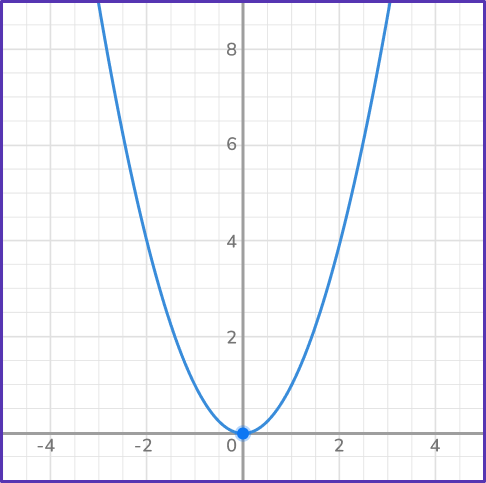
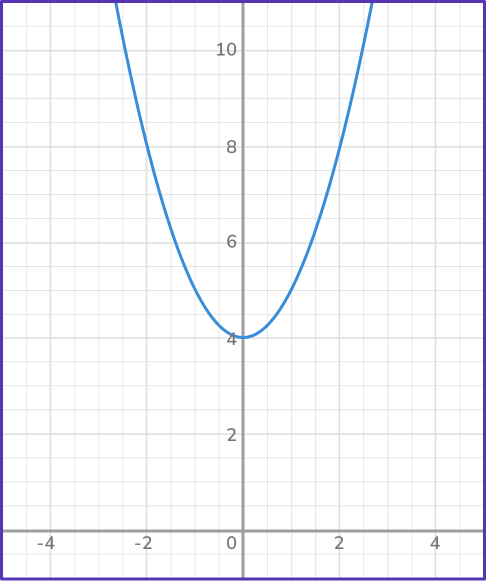

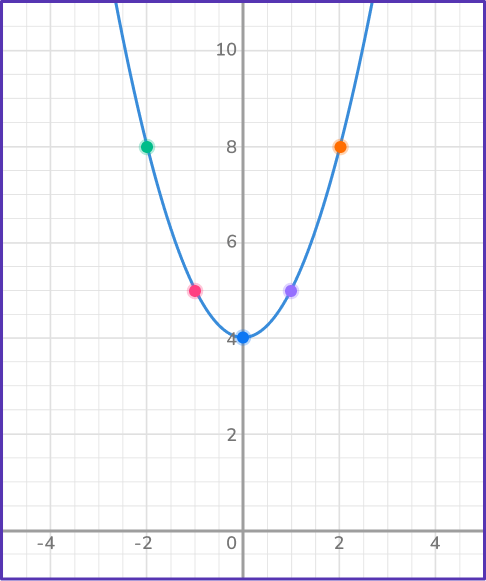
You can use any strategy to graph the quadratic. In this case, make a table of values or use the vertex and the axis of symmetry to sketch the quadratic function, y=x^2+4.
Making a table of values, you can select any x values you want. In this case, let’s use x values – \, 2, \, – \, 1, \, 0, \, 1, \, 2 and substitute into the original function to find the y -values.
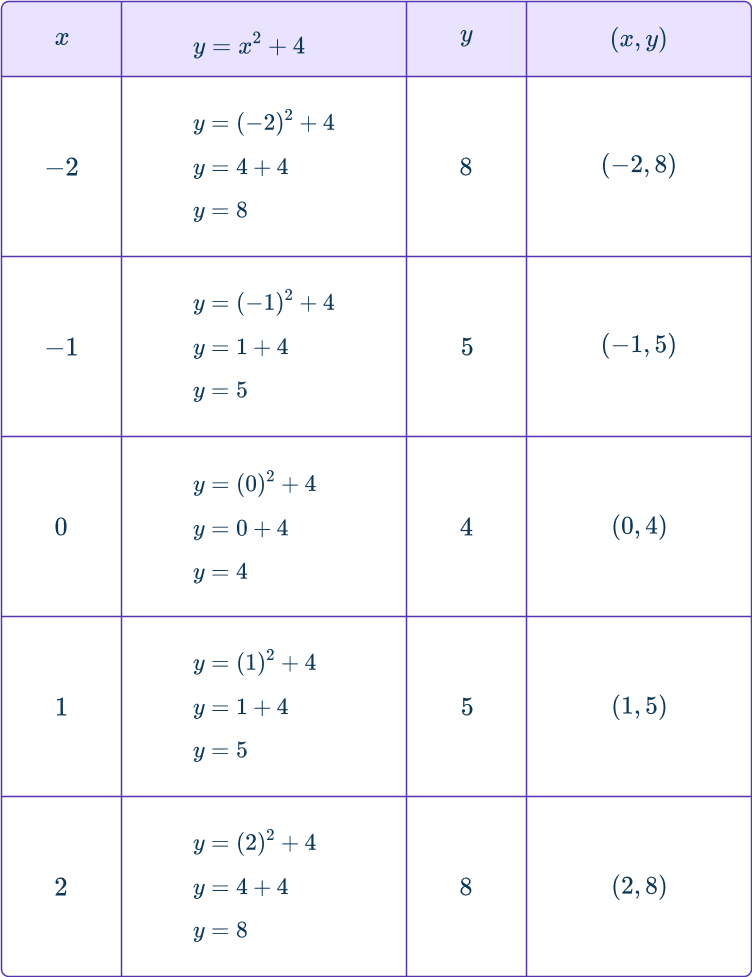
Once you calculate the y -values, plot them on the coordinate plane and then draw a smooth curve, parabola, through the points.
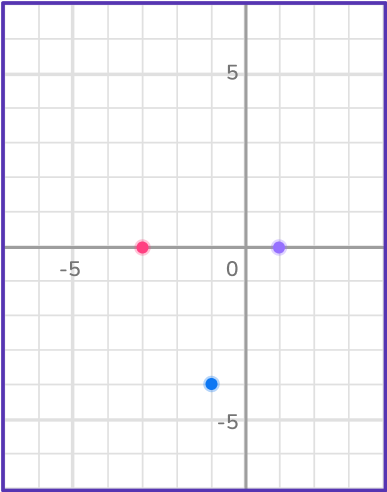
2. Select the graph of the quadratic function:
y=- \, x^2+4 x
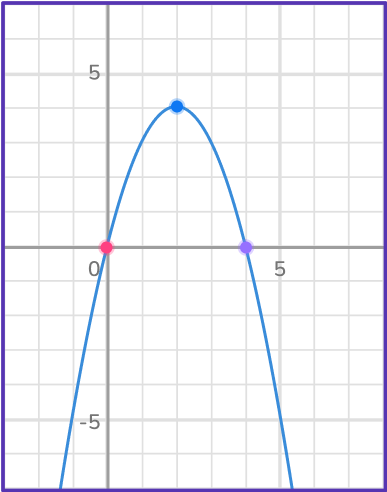
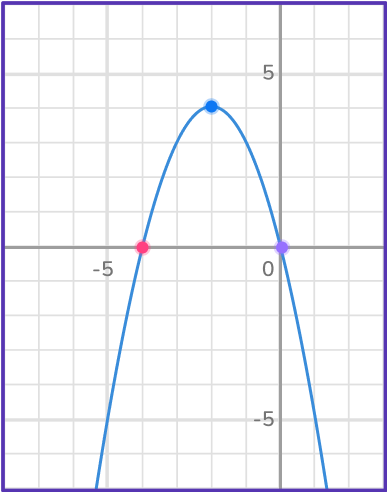
To graph the quadratic function, y=- \, x^2+4 x you can use any of the strategies. Let’s find the x -intercepts and the vertex.
Set the quadratic equation equal to 0 and solve for x.
\begin{array}{ll}- \, x^2+4 x=0 & \\\\ – \, x(x-4)=0 & \\\\ – \, x=0 \quad \quad \; x-4=0 \\\\ x=0 \quad \quad \quad x=4\end{array}
The solutions are the x -intercepts. So the coordinates of the x -intercepts are (0, \, 0) and (4, \, 0).
To find the vertex, first identify a, \, b, \, c which in this case is a=- \,1, \, b=4 and c=0
Remember, since “a” is negative, the parabola is upside down.
Substitute those values into x=\cfrac{- \, b}{2 a}
\begin{aligned}& x=\cfrac{- \, (4)}{2(- \, 1)}=\cfrac{- \, 4}{- \, 2}=2 \\\\ & x=2 \end{aligned}
The x -coordinate of the vertex is x=2 (which is also the equation of the axis of symmetry).
To find the y -coordinate, substitute in the x value and solve for y.
\begin{aligned}& y=- \, (2)^2+4(2) \\\\ & y=- \, 4+8 \\\\& y=4 \end{aligned}
The ordered pair of the vertex is: (2, \, 4)
Plot the x -intercepts and the vertex, and then draw a smooth curve through the points.

3. What is the axis of symmetry of the quadratic function?
f(x)=x^2-4 x+11
In order to find the axis of symmetry of a quadratic function, use the formula, x=\cfrac{- \, b}{2 a}. Before using the formula, identify the values of a, \, b, \, c.
\begin{aligned}a&=1 \\\\ b&=- \, 4 \\\\ c&=11 \end{aligned}
Substitute those values into the formula to calculate the axis of symmetry.
\begin{aligned}& x=\cfrac{- \, (- \,4)}{2(1)}=\cfrac{4}{2}=2 \\\\ & x=2 \end{aligned}
The axis of symmetry is the vertical line, x=2.
4. What is the vertex of the parabola formed by the quadratic function, y=- \, x^2+6 x-2?
To find the vertex of a quadratic in standard form, first identify a, \, b, \, c which in this case is a=- \, 1, \, b=6 and c=- \, 2.
Then substitute those values into the formula, x=\cfrac{- \, b}{2 a} find the x value of the ordered pair.
\begin{aligned}& x=\cfrac{- \, (6)}{2(- \, 1)}=\cfrac{- \, 6}{- \, 2}=3 \\\\ & x=3 \end{aligned}
The x coordinate of the vertex is 3. To find the y coordinate, substitute 3 in for x in the original equation.
\begin{aligned}& y=- \, x^2+6 x-2 \\\\ & y=- \, (3)^2+6(3)-2 \\\\ & y=- \, 9+18-2 \\\\ & y=9-2 \\\\ & y=7 \end{aligned}
The ordered pair of the vertex is (3, \, 7) .
5. What are the x -intercepts and axis of symmetry of the quadratic equation, y=2 x^2+7 x-4?
x -intercepts \left(\cfrac{1}{2}, \, 0\right) & (4, \, 0), axis symmetry x=\cfrac{7}{2}
x -intercepts \left(\cfrac{1}{2}, \, 0\right) & (- \, 4, \, 0), axis symmetry x=- \, \cfrac{7}{4}
x -intercepts \left(- \, \cfrac{1}{2}, \, 0\right) & (- \, 4, \, 0), axis symmetry x=- \, \cfrac{7}{4}
x -intercepts \left(- \, \cfrac{1}{2}, \, 0\right) & (4, \, 0), axis symmetry x=\cfrac{7}{2}
Factor the quadratic and solve for x to find the x -intercepts.
\begin{array}{ll}2 x^2+7 x-4=0 & \\\\ (2 x-1)(x+4)=0 \\\\ 2 x-1=0 \quad \quad \; x+4=0 \\\\ x=\cfrac{1}{2} \quad \quad \quad \quad \: x=- \, 4 \end{array}
The solutions to the quadratic are the x -intecepts. So, in this case, the x -intercepts are (\cfrac{1}{2}, \, 0) and (- \, 4, \, 0).
To find the axis of symmetry, identify a, \, b, \, c and substitute values into the formula, x=\cfrac{- \, b}{2 a}
\begin{aligned}& a=2, \, b=7, \, c=- \, 4 \\\\ &x=\cfrac {- \, (7)}{2(2)}=\cfrac{- \, 7}{4} \\\\ &x=- \, \cfrac{7}{4} \end{aligned}
The axis of symmetry is the vertical line, x=- \, \cfrac{7}{4}.
6. What are the x -intercepts of the quadratic function, f(x)=x^2+x-30?
(5, \, 0) and (- \, 6, \, 0)
(- \, 5, \, 0) and (- \, 6, \, 0)
(5, \, 0) and (6, \, 0)
(- \, 5, \, 0) and (6, \, 0)
The x -intercepts of a quadratic equation are the solutions. So, set the equation equal to 0 and solve it by factoring.
\begin{array}{ll}x^2+x-30=0 & \\\\ (x+6)(x-5)=0 & \\\\ x+6=0 \quad \quad \; x-5=0 \\\\ x=- \, 6 \quad \quad \quad x=5 \end{array}
So, the intercepts are the points (- \, 6, \, 0) and (5, \, 0).
Graphing quadratic functions FAQs
Yes, the x -intercepts are the solutions to the quadratic equation so if you can identify them from the graph, you have the solution. As long as the quadratic functions have real solutions, they will have x -intercepts.
However, if the quadratic equation has a complex solution, it will not have an x -intercept. So, you will have to rely on another strategy, such as using the quadratic formula or completing the square.
Yes, you can graph quadratic inequalities to find the solution set to quadratic inequalities.
When the solution to a quadratic equation is no real solutions, meaning that no real numbers are values to x, then the quadratic function does not intersect the x -axis.
Yes, the points of intersections graphically represent the solution(s) to a system of equations.
The next lessons are
Still stuck?
At Third Space Learning, we specialize in helping teachers and school leaders to provide personalized math support for more of their students through high-quality, online one-on-one math tutoring delivered by subject experts.
Each week, our tutors support thousands of students who are at risk of not meeting their grade-level expectations, and help accelerate their progress and boost their confidence.

Find out how we can help your students achieve success with our math tutoring programs.
[FREE] Common Core Practice Tests (3rd to 8th Grade)
Prepare for math tests in your state with these 3rd Grade to 8th Grade practice assessments for Common Core and state equivalents.
Get your 6 multiple choice practice tests with detailed answers to support test prep, created by US math teachers for US math teachers!