High Impact Tutoring Built By Math Experts
Personalized standards-aligned one-on-one math tutoring for schools and districts
In order to access this I need to be confident with:
Coordinate grid
Line graphs How to find the slope of a lineDistance time graph
Here you will learn about distance-time graphs, including how to interpret and construct them.
Students will first learn about distance time graphs as part of expressions and equations and functions in 8 th grade.
What are distance time graphs?
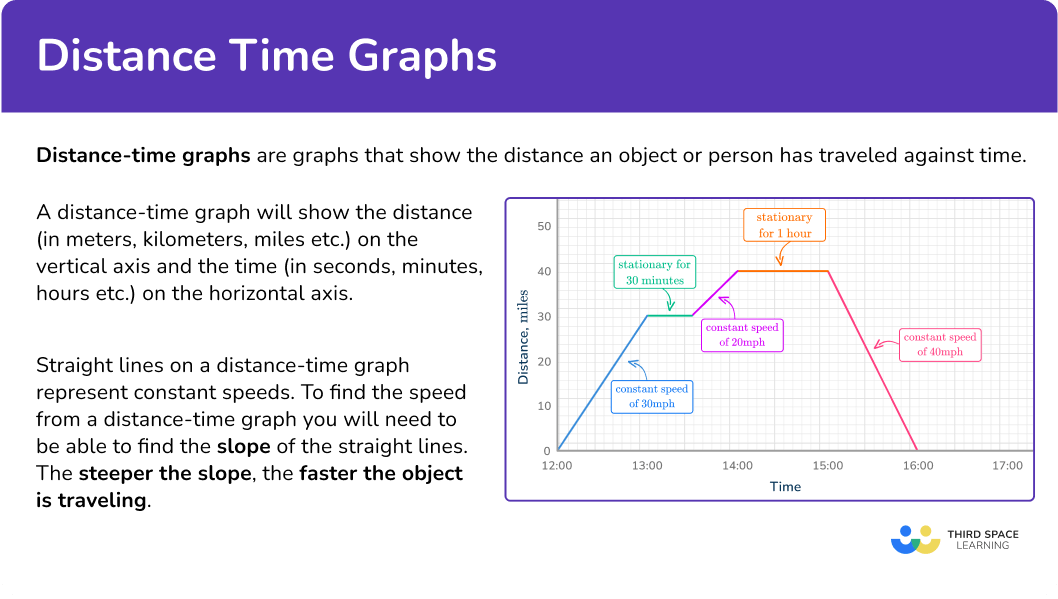
Distance-time graphs are graphs that show the distance an object or person has traveled against time. They can also be referred to as travel graphs.
A distance-time graph will show the distance (in meters, kilometers, miles etc.) on the vertical axis ( y -axis) and the time (in seconds, minutes, hours etc.) on the horizontal axis ( x -axis).
Note: The distance-time graphs on this page will all be drawn using straight lines.
Straight lines on a distance-time graph represent constant speeds. To find the speed from a distance-time graph, you will need to be able to find the slope of the straight lines.
The steeper the slope, the faster the object is traveling.
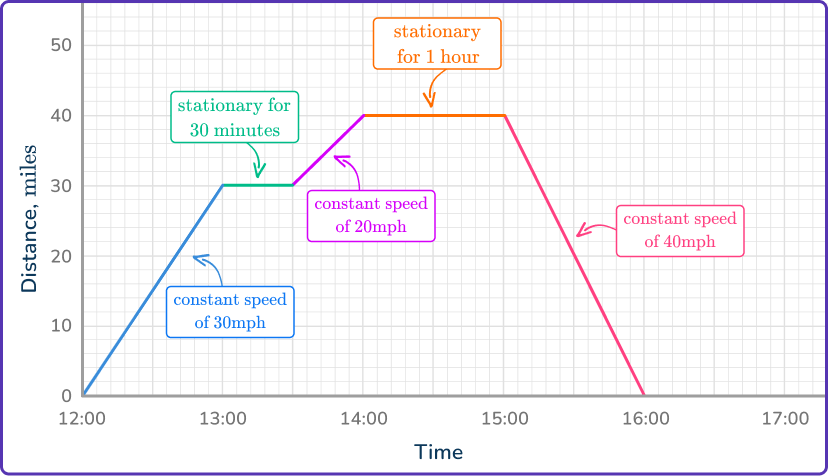
One way of calculating the speed from a distance-time graph is to think about how far the object has traveled in one time unit.
For example, if an object has traveled 20\mathrm{~miles} in 30\mathrm{~minutes}, it would travel 40\mathrm{~miles} in one hour, therefore the speed is 40\mathrm{~mph} .
What are distance time graphs?
![[FREE] Algebra Worksheet (Grade 6 to 8)](https://thirdspacelearning.com/wp-content/uploads/2023/07/Algebra-check-for-understanding-quiz-listing-image-.png)
[FREE] Algebra Worksheet (Grade 6 to 8)
Use this quiz to check your grade 6 to 8 students’ understanding of algebra. 10+ questions with answers covering a range of 6th and 8th grade algebra topics to identify areas of strength and support!
DOWNLOAD FREE [FREE] Algebra Worksheet (Grade 6 to 8)
Use this quiz to check your grade 6 to 8 students’ understanding of algebra. 10+ questions with answers covering a range of 6th and 8th grade algebra topics to identify areas of strength and support!
DOWNLOAD FREECommon Core State Standards
How does this relate to 8 th grade math?
- Grade 8 – Expressions and Equations (8.EE.B.5)
Graph proportional relationships, interpreting the unit rate as the slope of the graph. Compare two different proportional relationships represented in different ways. For example, compare a distance-time graph to a distance-time equation to determine which of two moving objects has greater speed.
- Grade 8 – Functions (8.F.B.4)
Construct a function to model a linear relationship between two quantities. Determine the rate of change and initial value of the function from a description of a relationship or from two (x, y) values, including reading these from a table or from a graph. Interpret the rate of change and initial value of a linear function in terms of the situation it models, and in terms of its graph or a table of values.
- Grade 8 – Functions (8.F.B.5)
Describe qualitatively the functional relationship between two quantities by analyzing a graph (e.g., where the function is increasing or decreasing, linear or nonlinear). Sketch a graph that exhibits the qualitative features of a function that has been described verbally.
How to read distance time graphs
In order to read distance time graphs:
- Locate any relevant points from the distance-time graph.
- Check the information required. For example, distance traveled at a selected time, period of being stationary, speed at a selected point in the journey.
- Use the appropriate process from the list.
- Distance traveled at a selected time – read from the \textbf{y} –axis at the given time.
- Period of being stationary – find the time when the line is horizontal.
- Speed at a selected point in the journey – find the slope of the line at that time.
- Average speed for the whole journey – divide the total distance traveled by the total time.
Distance time graphs examples
Example 1: finding the distance traveled from a distance-time graph
The distance-time graph shows the journey of a person from their home.
How far away from their home are they after 1\mathrm{~hour} and 30\mathrm{~minutes}?

- Locate any relevant points from the distance-time graph.
Locate 1\mathrm{~hour} \, 30\mathrm{~minutes} on the horizontal axis and go up to the graph line.
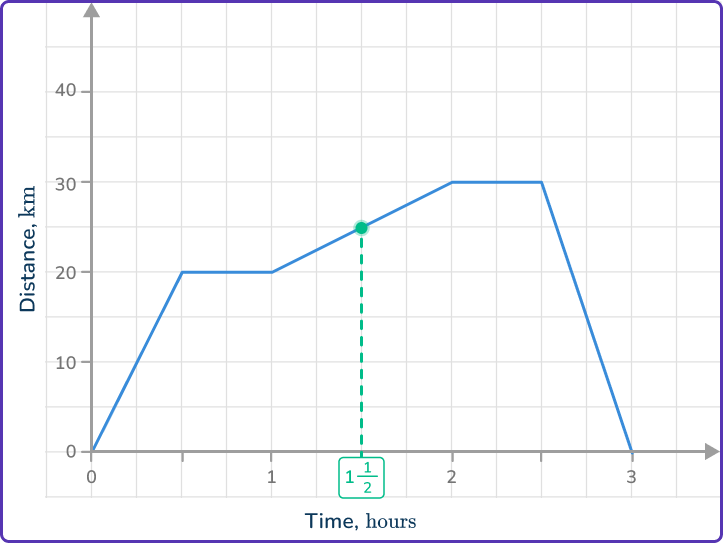
2Check the information required. For example, distance traveled at a selected time, period of being stationary, speed at a selected point in the journey.
This question requires the distance traveled at that time.
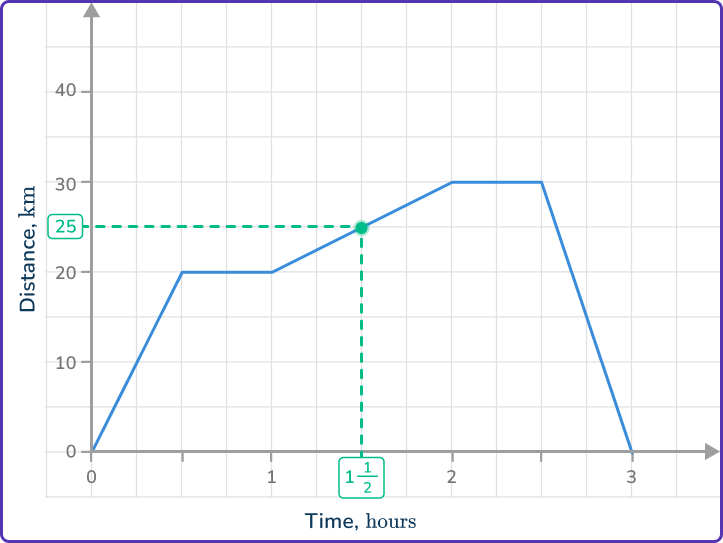
3Use the appropriate process from the list. Distance traveled at a selected time – read from the \textbf{y} –axis at the given time.
Reading from the vertical axis gives a distance of 25\mathrm{~km}.
Example 2: finding stationary periods from a distance-time graph
The distance-time graph shows the journey of a person from their home.
At what time did the person first stop and for how long?
Locate the points in the graph when the line changes.
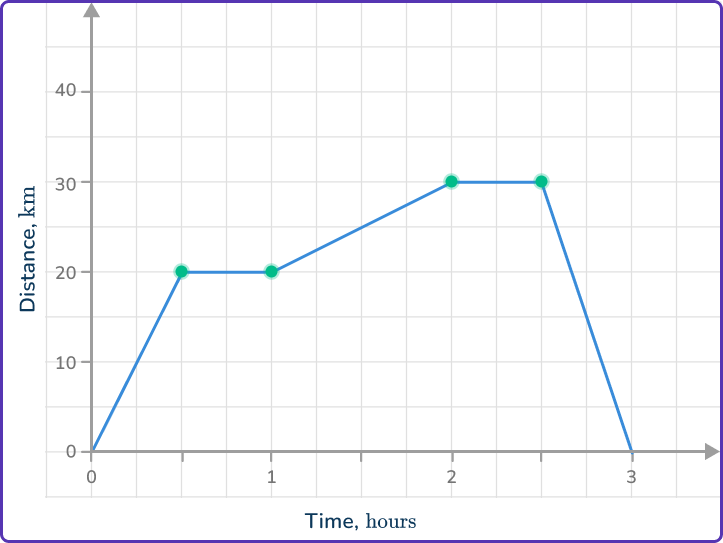
This question requires the first period that the person was stationary.
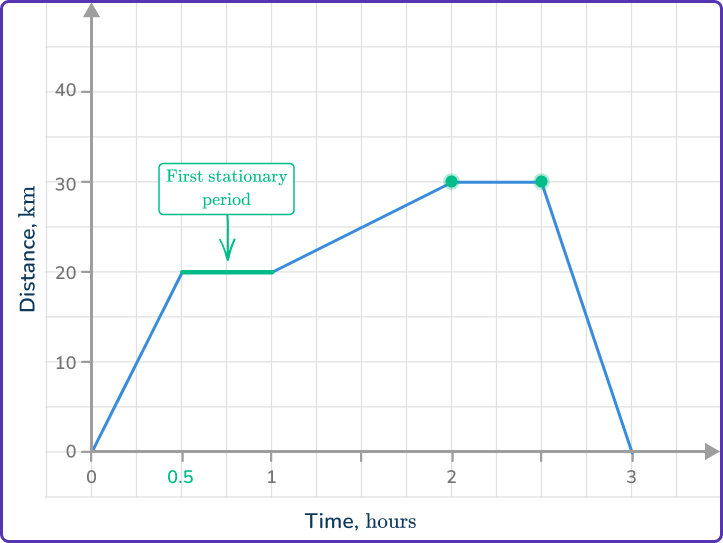
The person was first stationary after 30\mathrm{~minutes}, and remained stationary for 30\mathrm{~minutes}.
Example 3: finding the speed from a distance-time graph
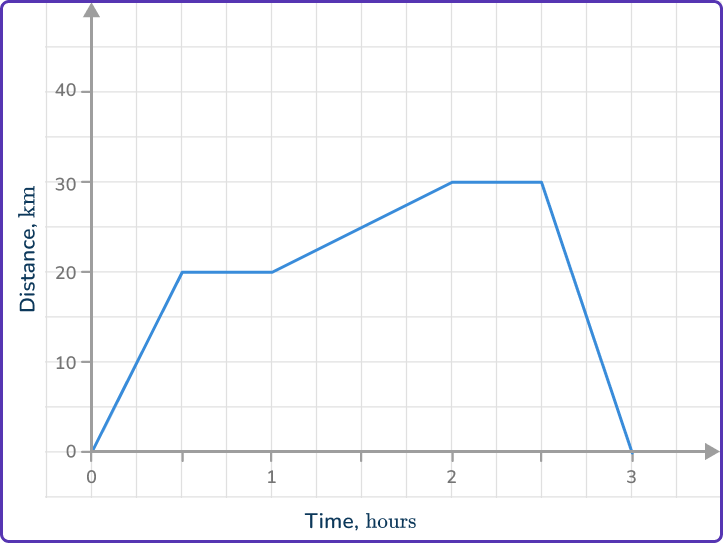
The distance-time graph shows the journey of a person from the cafe to their home.
The person starts at the cafe, where they stay a while for a drink and snack. They then ran for an hour, before taking a taxi home.
What speed was the person traveling during the taxi journey home?
The journey home began after 2\mathrm{~hours} \, 30\mathrm{~minutes} and finished at 3\mathrm{~hours}.
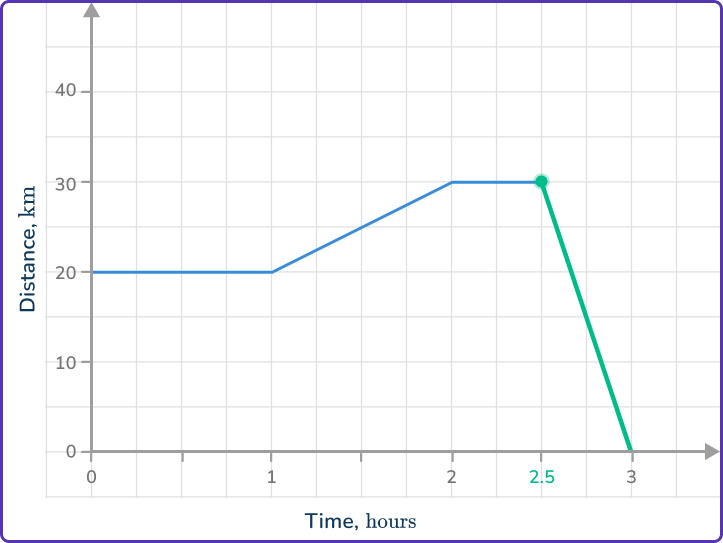
This question requires the speed between 2.5\mathrm{~hours} and 3\mathrm{~hours}.
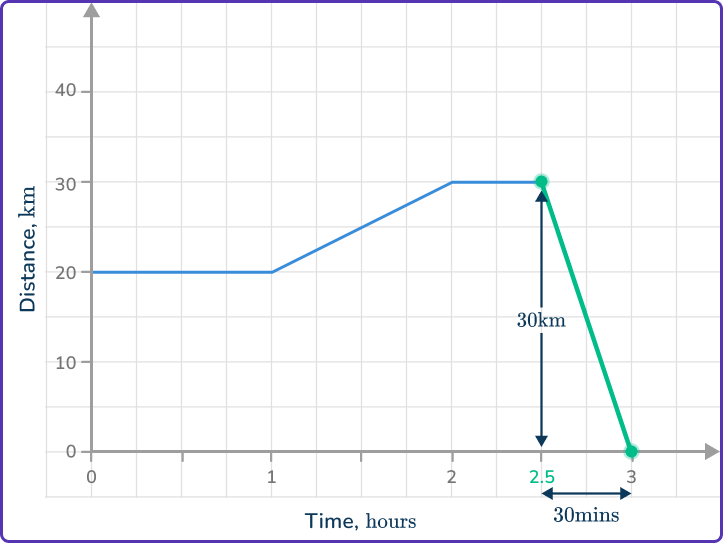
The person traveled 30\mathrm{~km} in 30\mathrm{~minutes}, this would mean they would travel 60\mathrm{~km} in 1\mathrm{~hour}, therefore, their speed was 60\mathrm{~km/h}.
You could also find this using the speed, distance, time formula.
\text{Speed}=\cfrac{\text{distance}}{\text{time}}=\cfrac{30}{0.5}=60\mathrm{~km/h}
(it is important to use 0.5\mathrm{~hours} and not 30\mathrm{~minutes} for the time, since the units are kilometers per hour).
Or you could have found the slope of the line,
\cfrac{\text{Change in }y}{\text{Change in }x}=\cfrac{30}{0.5}=60.
Example 4: finding the average speed the whole journey from a distance-time graph
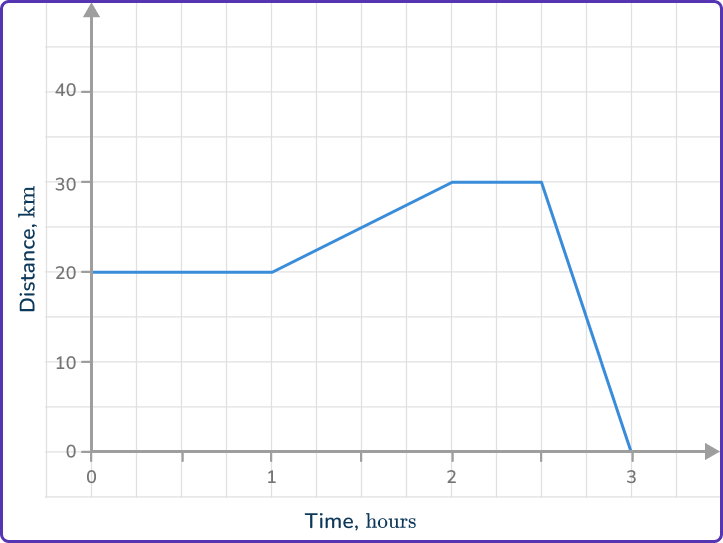
The distance-time graph shows the journey of a person from their home.
The graph shows the person taking a bus to a library. They then stopped at the library to do some research. They then ran for an hour, before taking a taxi home.
What was the person’s average speed for their whole journey?
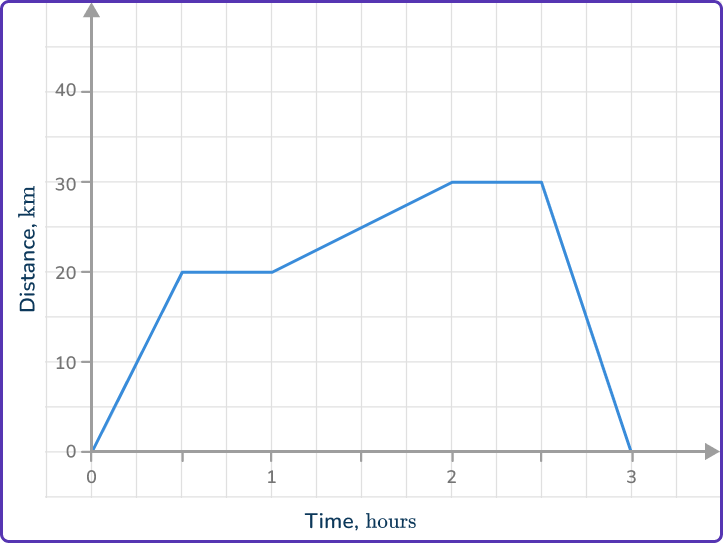
Find the total distance traveled.
This question requires the average speed for the whole journey.
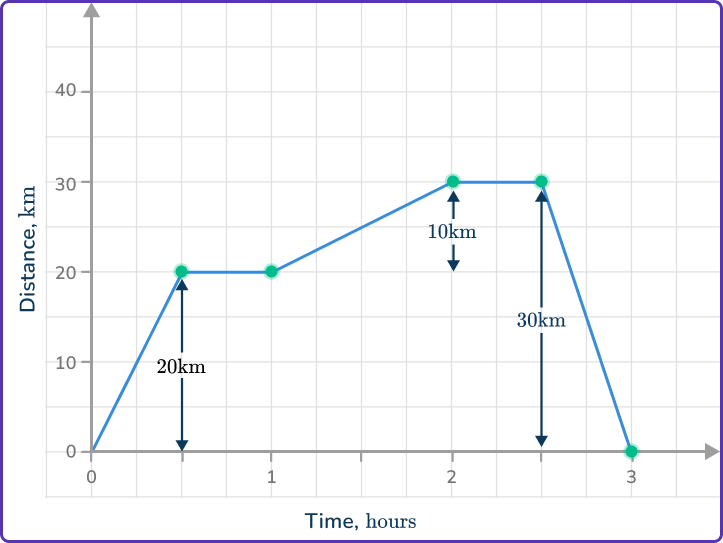
It is important to add all the distances traveled and find the time for the whole journey including any periods when the person was stationary.
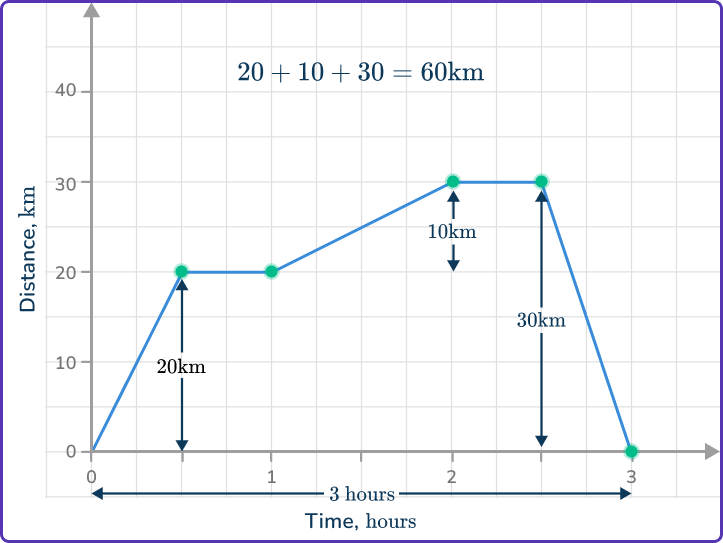
\text{Average speed}=\cfrac{\text{Total distance}}{\text{Total time}}=\cfrac{60}{3}=20\mathrm{~km/h}.
How to draw distance time graphs
In order to draw distance-time graphs:
- Draw/label the horizontal axis for the time and a vertical axis for the distance.
- Use the information about the distance or speed of the object to plot points on the graph.
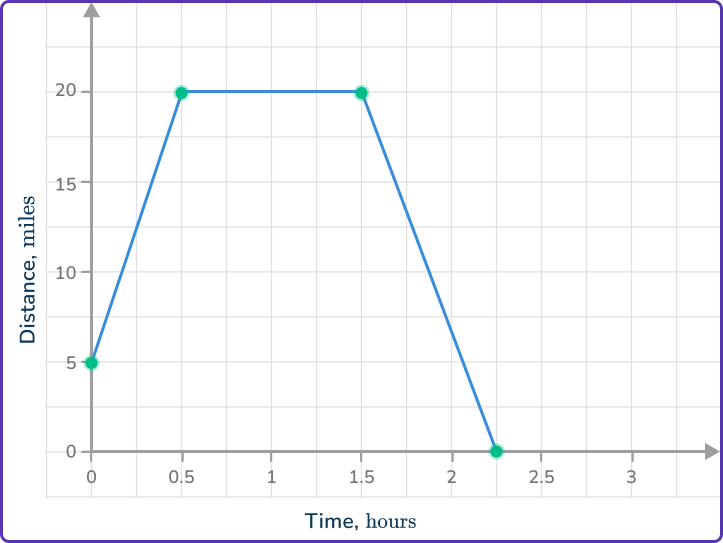
- Join the points with straight line segments.
Drawing distance time graph examples
Example 5: drawing a distance-time graph from information about distance at given times
A car starts 5\mathrm{~miles} from home and travels at a constant speed for 30\mathrm{~minutes} until it is 20\mathrm{~miles} from home. It then stops for 1\mathrm{~hour} before returning home, traveling at a constant speed for 45\mathrm{~minutes}.
Draw a distance-time graph to represent the journey.
The car gets no further than 20\mathrm{~miles} from home and the journey takes a total of 2\mathrm{~hours} \, 15\mathrm{~minutes}. Draw and label the vertical axis from 0 to 20\mathrm{~miles} and the horizontal axis from 0 to 3\mathrm{~hours}.
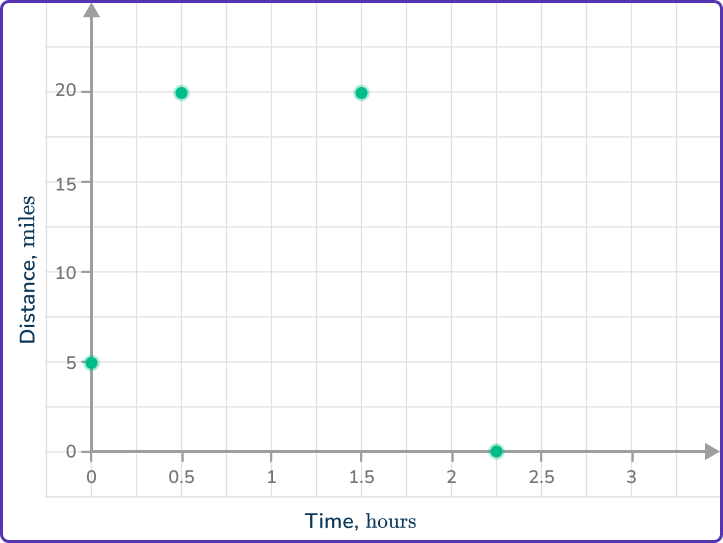
The car starts 5\mathrm{~miles} from home, so plot the point (0, 5).
After 30\mathrm{~minutes} the car has traveled as far as 20\mathrm{~miles}, so plot the point (0.5, 20).
It remains stationary for 1\mathrm{~hour}, so plot the point (1.5, 20).
It then returns home after 45\mathrm{~minutes}, so plot the point (2.25, 0).
Example 6: drawing a distance-time graph from information about speed at given times
A car leaves home at 12\text{:}00\mathrm{~pm} and sets off at a constant speed of 30\mathrm{~mph}. At 12\text{:}30\mathrm{~pm} the car stops for 10\mathrm{~minutes}. It then returns home at a speed of 45\mathrm{~mph}.
Draw a distance-time graph to represent the journey.
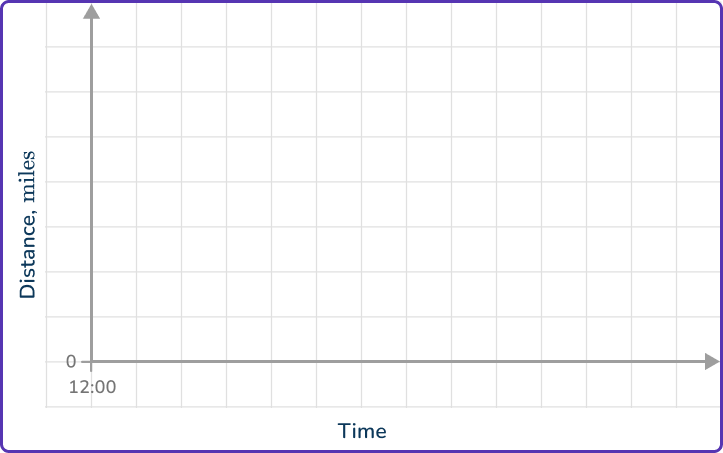
Draw the horizontal and vertical axes. Add the labels once you know more information about the maximum distance and times taken based on the information provided about the speed.
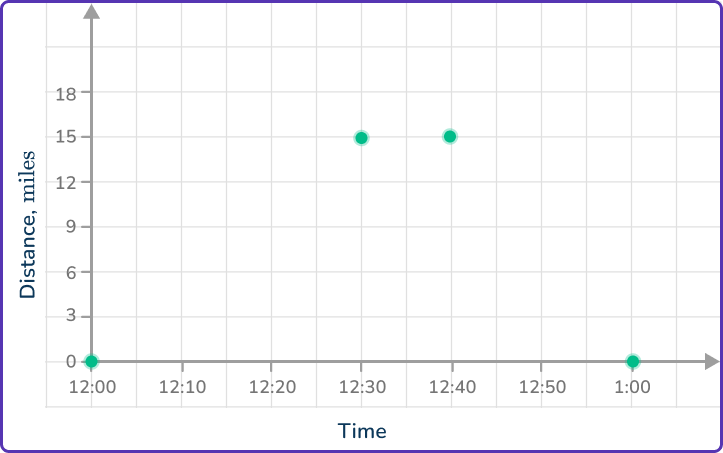
Plot (12\text{:}00, 0).
The car travels at a speed of 30\mathrm{~mph} between 12\text{:}00 and 12\text{:}30.
As \text{Distance}=\text{Speed}\times\text{Time}, 30\mathrm{~mph} over 30\mathrm{~minutes} (half an hour), means the car travels 30\times{0.5}=15\mathrm{~miles} so we will need to plot (12\text{:}30, 15).
The car stops for 10\mathrm{~minutes}, so we will need to plot (12\text{:}40, 15).
The car returns home at a speed of (12\text{:}40, 15).
You can use \text{Time}=\cfrac{\text{Distance}}{\text{Speed}}=\cfrac{15}{45}=\cfrac{1}{3} \, hour, so it will take 20\mathrm{~minutes} to travel 15\mathrm{~miles}.
The car will return home at 1\text{:}00\mathrm{~pm} so plot (1\text{:}00, 0).
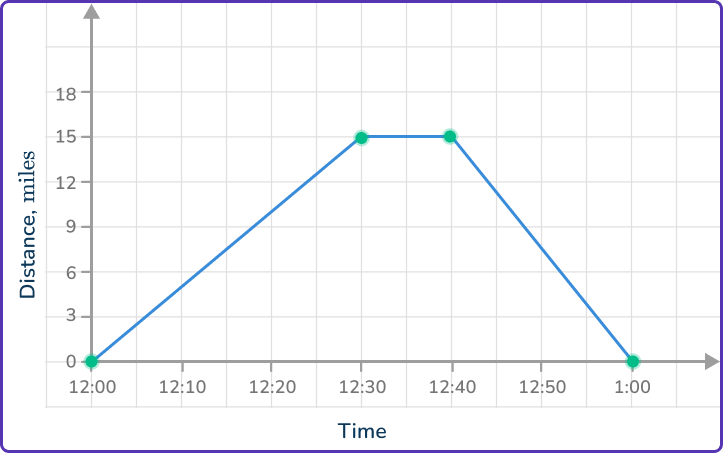
Choose appropriate scales for the axes and plot the points.
Teaching tips for distance time graphs
- Instead of relying on worksheets, incorporate as many real life examples and experiences as possible when working with distance time graph. This will give students background knowledge and context to draw on when they are working with abstract examples.
- Be sure that students have a background in straight-line graphs, or linear equations, before introducing this topic, as well as the speed, distance, time compound unit formula. They need to have an understanding of intercepts and slope before they can interpret these within a distance time graph.
Easy mistakes to make
- Confusing distance-time graphs with speed-time graphs
It is common for students to confuse distance-time graphs with speed-time graphs, acceleration time graphs or velocity time graphs. This may result in students just reading a value from the vertical axis instead of calculating the slope of a distance-time graph to find the speed of an object.
- Calculating average speed incorrectly
The average speed could be incorrectly calculated by finding the mean of the different speeds during a journey. Another incorrect method is to only use the sections of the graph when the object is moving and to forget to include the periods when it is stationary.
- Thinking that the graph must starting point is always \bf{(0,0)}
If the object or person is a distance from the place that is represented by the y –axis, then it will not start at the origin. Refer to examples 3 and 5 above.
- Drawing impossible distance-time graphs
There are some graphs that would be impossible for a distance-time graph.
For example,- Vertical lines would represent an infinite speed
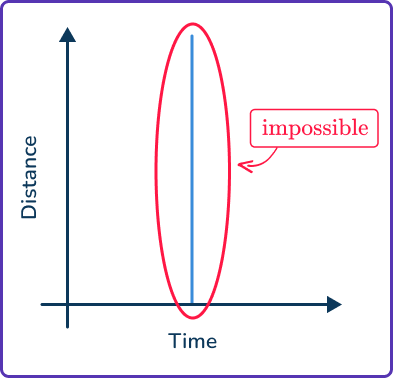
- Going backwards on the graph would represent objects traveling back in time
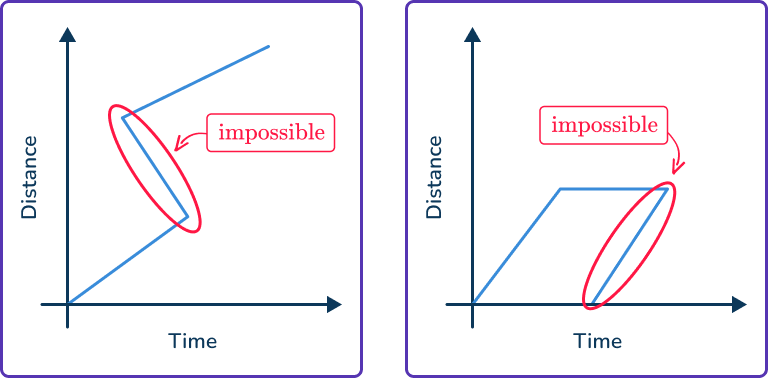
- Vertical lines would represent an infinite speed
Related rate of change lessons
- Rate of change formula
- Velocity vs time graph
Practice distance time graph questions
1. A horizontal line on a distance-time graph shows that …
The object is accelerating.

The object is stationary.

The object is moving at a constant speed.
The object is decelerating.
A horizontal line shows the object is covering zero distance for a period of time.
2. Which of the distance-time graphs shows an object moving at the greatest speed?
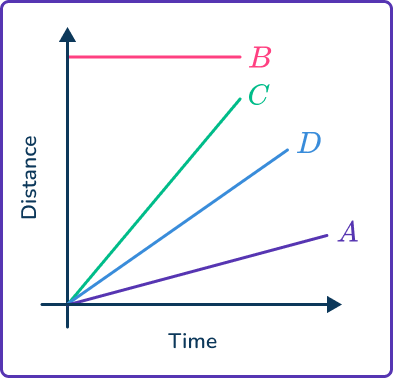
The speed is represented by the slope on distance-time graphs, so greater speeds have a steeper slope.
3. What is the speed of the object shown in this distance-time graph?
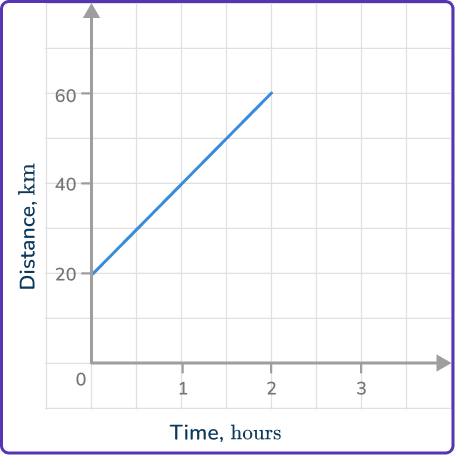
The object travels 40\mathrm{~km} in 2\mathrm{~hours}.
The speed can be found by finding the slope or using the formula
\text{Speed}=\cfrac{\text{Distance}}{\text{Time}}.\text{Speed}=\cfrac{40}{2}=20\mathrm{~km/h}
4. What is the speed of the object shown in this distance-time graph?
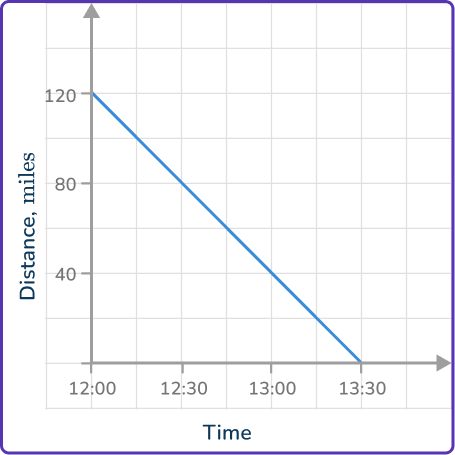
The object travels 120\mathrm{~miles} in 1.5\mathrm{~hours}.
The speed can be found by finding the slope or using the formula
\text{Speed}=\cfrac{\text{Distance}}{\text{Time}}.\text{Speed}=\cfrac{120}{1.5}=80\mathrm{~mph}
5. An object travels away from home at a speed of 60\mathrm{~km/h} for half an hour. It then stops and remains stationary for a quarter of an hour before returning home at a speed of 40\mathrm{~km/h}. Select the correct distance-time graph for the journey.

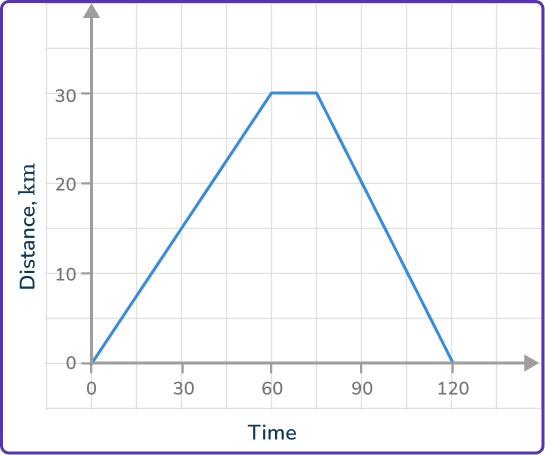
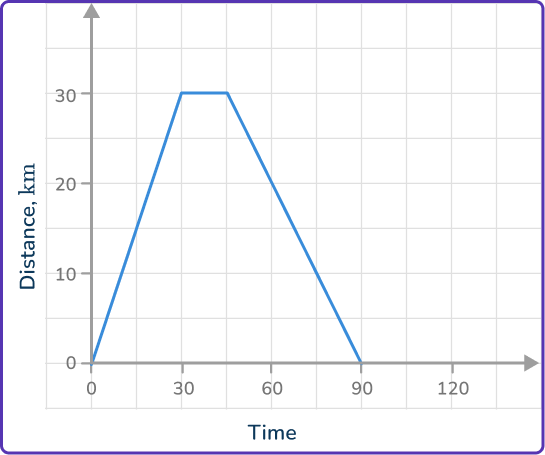
First part:
60\mathrm{~km/h} for 30\mathrm{~minutes} is a distance of 30\mathrm{~km}. So the graph starts at (0, 0) and goes to (30, 30).
Second part:
A quarter of an hour is 15\mathrm{~minutes}, so from 30 to 45\mathrm{~minutes} the graph is horizontal, so the stop is from (30, 30) to (45, 30).
Third part:
30\mathrm{~km} at 40\mathrm{~km/h} is T=\cfrac{30}{40}=\cfrac{3}{4}\mathrm{~hours}.
\cfrac{3}{4}\mathrm{~hours} is 45\mathrm{~minutes}, so the ride home is from (45, 30) and ends at (90,0).
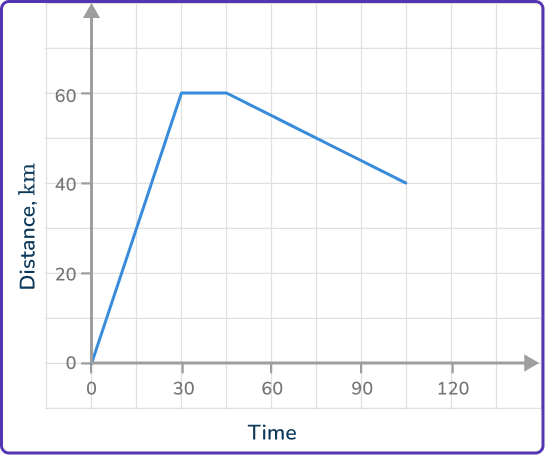
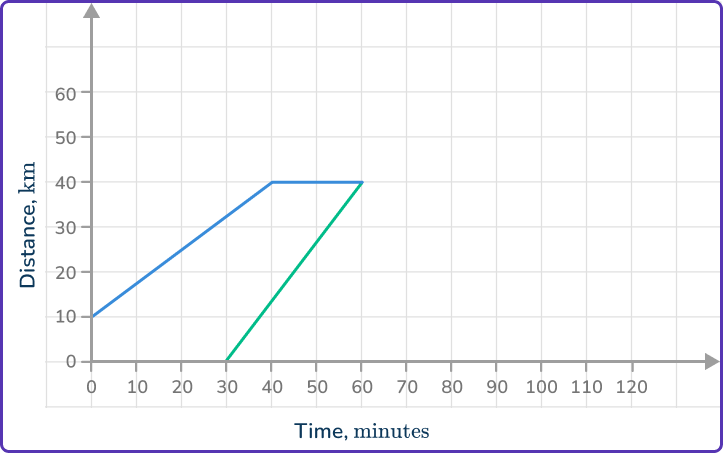
6. The image shows part of a distance-time graph.
The last part of the journey is for the object to return home at a speed of 80\mathrm{~km/h}. Which is the correct completed distance-time graph?

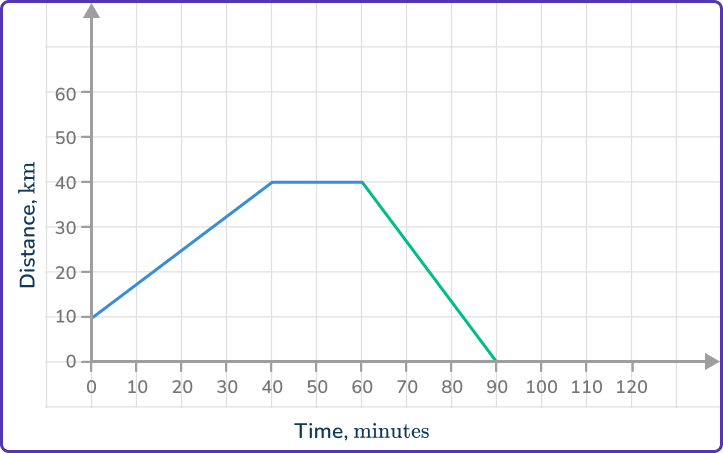
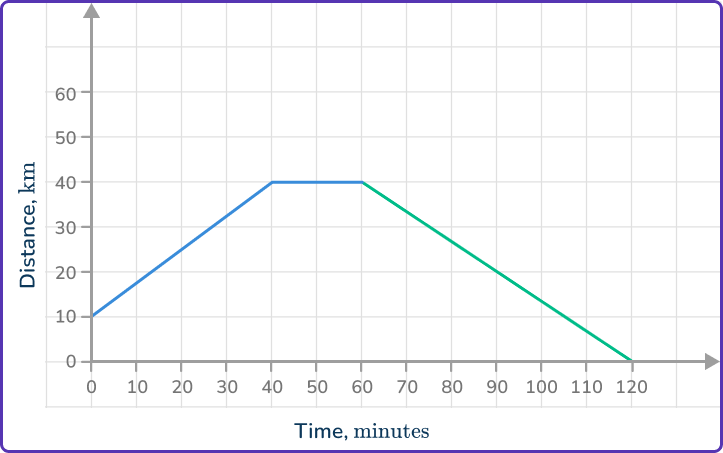
40\mathrm{~km} at 80\mathrm{~km/h} will take 30\mathrm{~minutes}. The journey ends after 90\mathrm{~minutes}.
30\mathrm{~km} at 80\mathrm{~km/h} is T=\cfrac{40}{80}=\cfrac{1}{2}\mathrm{~hour}.
\cfrac{1}{2}\mathrm{~hour} is 30\mathrm{~minutes}, so the ride home is from (60, 40) and ends at (90,0).
Distance time graph FAQs
This is the gradient of the line shown in a distance-time graph. Gradient is another word for slope.
Yes, when an object is speeding up or slowing down, the graph will curve.
Yes, besides mathematics, students will use these equations in Science classes such as Physics and in Career and Technical classes where these equations are relevant.
The next lessons are
Still stuck?
At Third Space Learning, we specialize in helping teachers and school leaders to provide personalized math support for more of their students through high-quality, online one-on-one math tutoring delivered by subject experts.
Each week, our tutors support thousands of students who are at risk of not meeting their grade-level expectations, and help accelerate their progress and boost their confidence.

Find out how we can help your students achieve success with our math tutoring programs.
[FREE] Common Core Practice Tests (3rd to 8th Grade)
Prepare for math tests in your state with these 3rd Grade to 8th Grade practice assessments for Common Core and state equivalents.
Get your 6 multiple choice practice tests with detailed answers to support test prep, created by US math teachers for US math teachers!