High Impact Tutoring Built By Math Experts
Personalized standards-aligned one-on-one math tutoring for schools and districts
In order to access this I need to be confident with:
Ratios and proportions
Plotting points on a graph Coordinate PlaneConstant of variation
Direct variation
Here you will learn about direct variation, including the constant of variation, the equation that represents direct variation, and interpreting the graphs of direct variation.
Students first learn about proportional relationships on a graph in the 6th grade with ratio tables in ratios and proportional relationships.
What is direct variation?
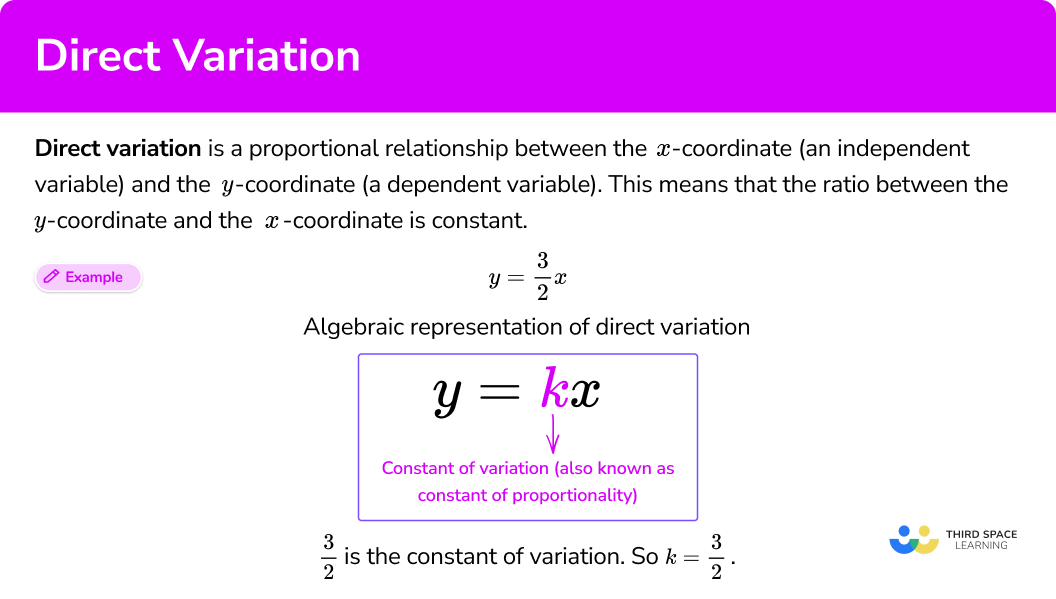
Direct variation is a proportional relationship between the x -coordinate (an independent variable) and the y -coordinate (a dependent variable), where the ratio between the x -coordinate and the y -coordinate is constant.
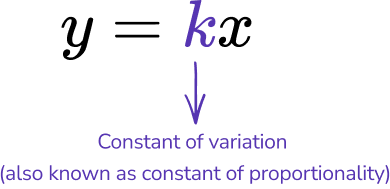
Direct variation is represented algebraically by the equation,
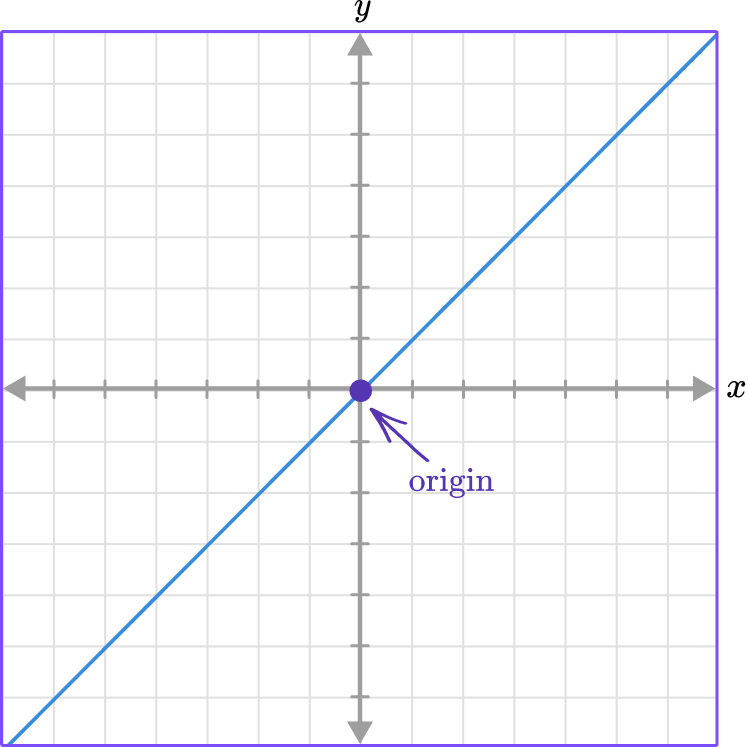
Direct variation is represented graphically by a line that goes through the origin.
Let’s look at some examples,
The equation y=\cfrac{1}{6} \, x represents direct variation. What is the constant of variation?
The constant of variation is represented by k in the equation y=kx.
So in this case, \, \cfrac{1}{6} \, is the constant of variation.
k=\cfrac{1}{6}
You can use a graph to determine the constant of variation.
For example, use the graph to find the constant of variation.
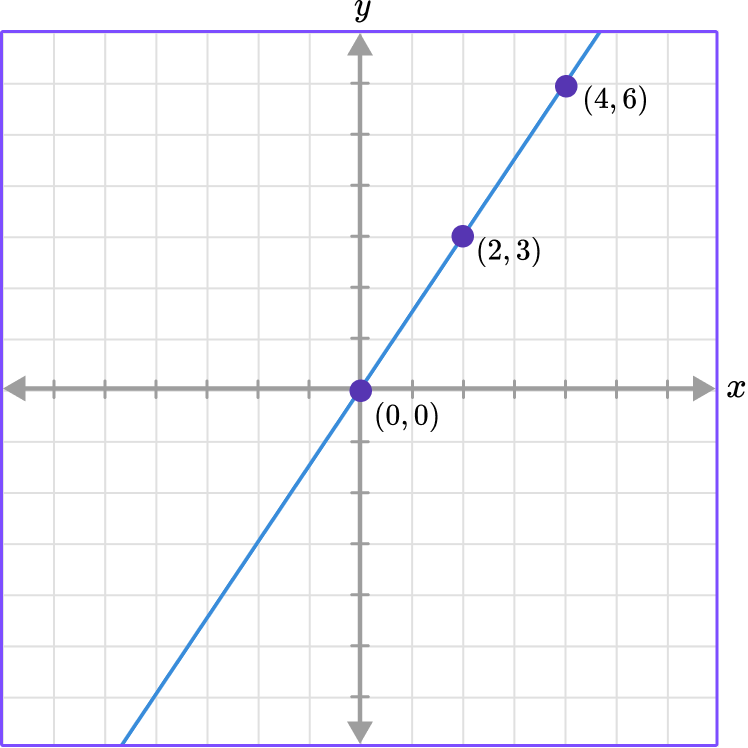
The line goes through the origin and also contains the points of (2, 3) and (4, 6).
To find the constant of variation or the constant of proportionality you can write the ratio of the points in the form of \, \cfrac{y}{x} \, because k=\cfrac{y}{x} .
Choosing the point (2, 3) the ratio is \, \cfrac{3}{2} \, which means that k=\cfrac{3}{2} .
The constant of variation, k, can also be found by counting the units from one point to the next. You can see that from (0, 0) to (2, 3) you moved to the right 2 units and up 3 units, and from points (2, 3) to (4, 6) the same movement occurred.
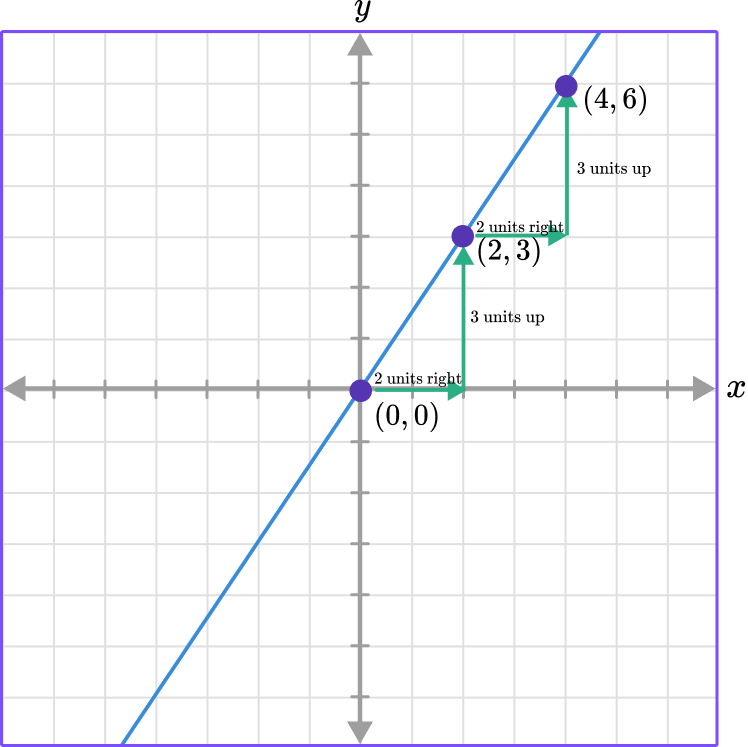
The constant movement from one point to the next is also called the constant rate of change.
What is direct variation?
Common Core State Standards
How does this relate to grade 7 math and grade 8 math?
- Grade 7 – Ratios and Proportional Relationships (7.RP.A.2.b)
Identify the constant of proportionality (unit rate) in tables, graphs, equations, diagrams, and verbal descriptions of proportional relationships.
- Grade 7 – Ratios and Proportional Relationships (7.RP.A.2.c)
Represent proportional relationships by equations.
- Grade 8 – Expressions and Equations (8.EE.B.5)
Graph proportional relationships, interpreting the unit rate as the slope of the graph. Compare two different proportional relationships represented in different ways.
![[FREE] Direct Variation Worksheet (Grade 7 and 8)](https://thirdspacelearning.com/wp-content/uploads/2024/10/Direct-Variation-Worksheet-listing-image.png)
[FREE] Direct Variation Worksheet (Grade 7 and 8)
Use this worksheet to check your 7th grade and 8th grade students’ understanding of direct variation. 15 questions with answers to identify areas of strength and support!
DOWNLOAD FREE [FREE] Direct Variation Worksheet (Grade 7 and 8)
Use this worksheet to check your 7th grade and 8th grade students’ understanding of direct variation. 15 questions with answers to identify areas of strength and support!
DOWNLOAD FREEHow to use direct variation
In order to find the constant of variation from an equation:
- Compare the equation to \textbf{y = kx} to determine the value of \textbf{k} .
- Write the value of \textbf{k} .
In order to find the constant of variation from a graph:
- Select a point.
- Write the point as a ratio in the form of \cfrac{\textbf{y}}{\textbf{x}} \, .
- Write the value of \textbf{k} .
In order to find the equation of direct variation from a point:
- Select a point and define the \textbf{x} value and the \textbf{y} value.
- Substitute the values into the equation \textbf{y = kx} to find \textbf{k} .
- Solve for \textbf{k} .
- Write the equation of direct variation.
Direct variation examples
Example 1: find the constant of variation from an equation
What is the constant of variation in the equation y=\cfrac{3}{5} \, x ?
- Compare the equation to \textbf{y = kx} to determine the value of \textbf{k} .
Comparing the equation y=\cfrac{3}{5} \, x to y=kx , you can see that \, \cfrac{3}{5} \, represents the constant of variation.
2Write the value of \textbf{k} .
k=\cfrac{3}{5}
Example 2: find the constant of variation from an equation
What is the constant of variation in the equation y=-6x?
Compare the equation to \textbf{y = kx} to determine the value of \textbf{k} .
Comparing the equation y=-6x to y=kx, you can see that the -6 represents the constant of variation.
Write the value of \textbf{k} .
k=-6
Example 3: find the constant of variation from a graph
Use the graph to find the constant of variation.
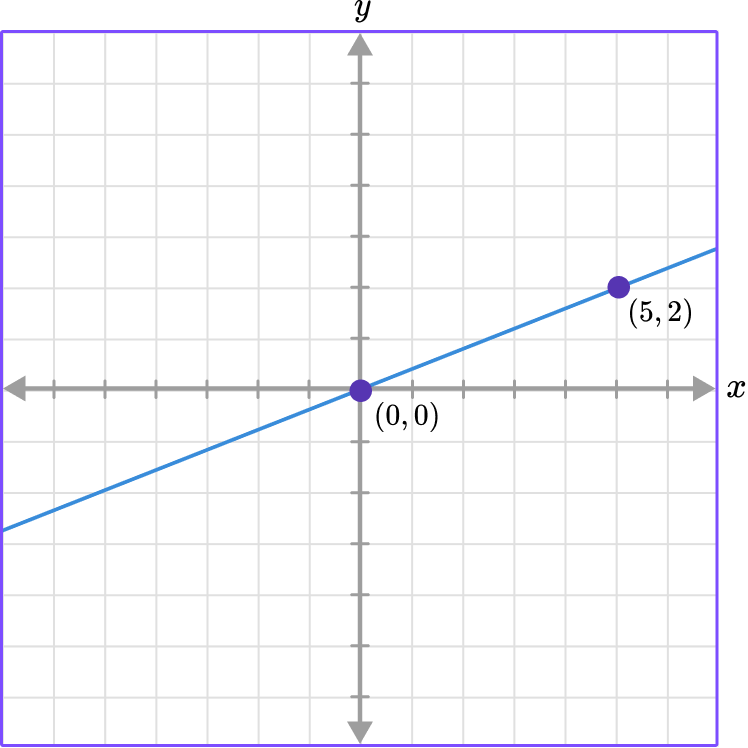
Select a point.
Use the point (5, 2) .
Write the point as a ratio in the form of \, \cfrac{\textbf{y}}{\textbf{x}} \, .
(5,2) \rightarrow \cfrac{2}{5}
Write the value of \textbf{k} .
k=\cfrac{2}{5}
Example 4: find the constant of variation from a graph
Use the graph to find the constant of variation.
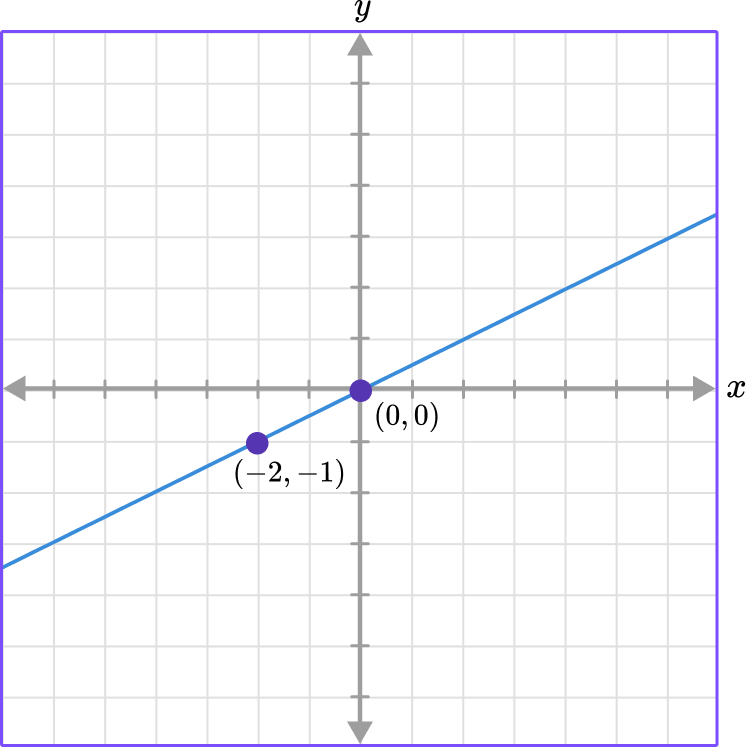
Select a point.
Use the point (-2, -1).
Write the point as a ratio in the form of \, \cfrac{\textbf{y}}{\textbf{x}} \, .
(-2,-1) \rightarrow \cfrac{-1}{-2}=\cfrac{1}{2}
Write the value of \textbf{k} .
k=\cfrac{1}{2}
Example 5: finding the equation of direct variation
If x varies directly with y, find the equation of direct variation from the point (7, 3).
Select a point and define the \textbf{x} value and the \textbf{y} value.
The point is (7, 3) which means that x=7 and y=3.
Substitute the values into the equation \textbf{y = kx} to find \textbf{k} .
\begin{aligned} & y=k x \\\\ & 3=k( 7) \end{aligned}
Solve for \textbf{k} .
\begin{aligned} & 3=k (7) \\\\ & \cfrac{3}{7}=\cfrac{k (7)}{7} \\\\ & \cfrac{3}{7}=k \end{aligned}
Write the equation of direct variation.
k=\cfrac{3}{7}
So, y=\cfrac{3}{7} \, x .
Example 6: finding the equation of direct variation
The graph represents a direct variation. Find the equation.
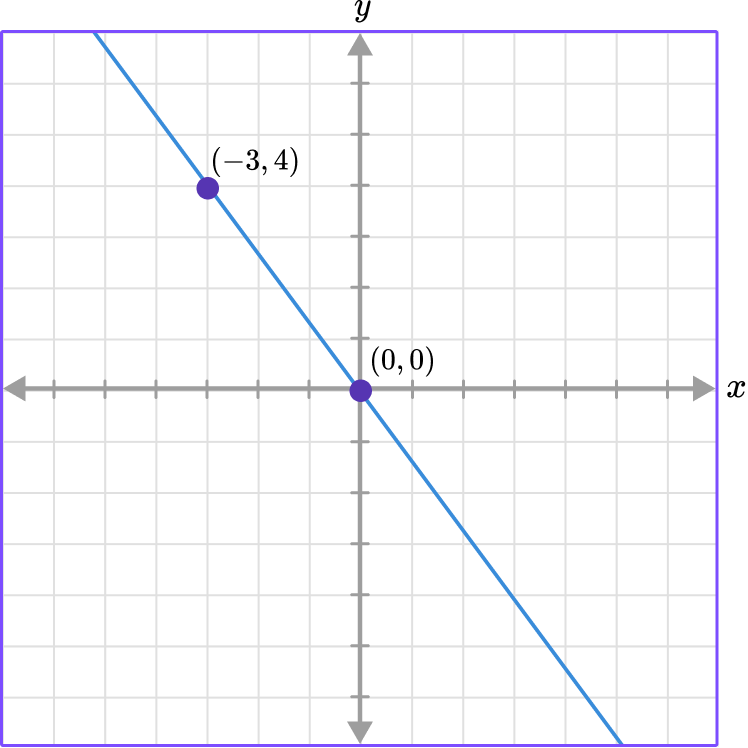
Select a point and define the \textbf{x} value and the \textbf{y} value.
Use the point (-3, 4) where x=-3 and y=4 .
Substitute the values into the equation \textbf{y = kx} to find \textbf{k} .
\begin{aligned} & y=k x \\\\ & 4=k(-3) \end{aligned}
Solve for \textbf{k} .
\begin{aligned} & 4=k(-3) \\\\ & \cfrac{4}{-3}=\cfrac{k(-3)}{-3} \\\\ & \cfrac{4}{-3}=k \end{aligned}
Write the equation of direct variation.
k=\-cfrac{4}{3}
So, y=-\cfrac{4}{3} \, x .
Teaching tips for direct variation
- Reinforce to students that the common ratio of points is the constant of proportionality which is the constant of variation k.
- Using digital graphing platforms such as Desmos or actual graphing calculators helps students make connections between the visual representation of direct variation and the equation that represents the direct variation.
- Create situations where students can connect the constant of variation with the slope of the line or the constant rate of change of the line.
- Use real life direct variation word problems and graphs for students to analyze and see the relevance of the concept in the world around them.
- Although practice worksheets help students practice skills, focus on making the math relevant to their everyday lives.
- Through discovery based activities and questioning strategies, lead students to think about the direct variation equation, y=kx, where the constant of variation is the constant rate of change, which will eventually be the slope, and the origin is the y -intercept.
Easy mistakes to make
- Thinking that the constant of variation has to be positive
The constant of variation, k, can be positive or negative. k is the ratio of the y -coordinate to the x -coordinate.
- Thinking that the line that represents direct variation does not have to go through the origin
Direct variation is a linear, proportional relationship, which means it must pass through the origin. If the line does not pass the origin, it is not a representation of direct variation.
- Substituting the \textbf{x} -coordinate in for the \textbf{y} -coordinate and vice versa
When you are given a point and need to find the equation of direct variation, substitute the x -coordinate in for the x value and the y -coordinate for the y -value.
For example, (6, 3)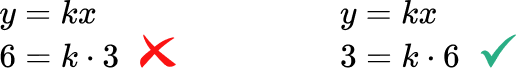
Practice direct variation questions
1. What is the constant of variation of the equation, y=-7x?


The equation y=-7x compared to y=kx, shows that -7 represents the constant of variation. k=-7
2. What is the constant of variation from the graph?
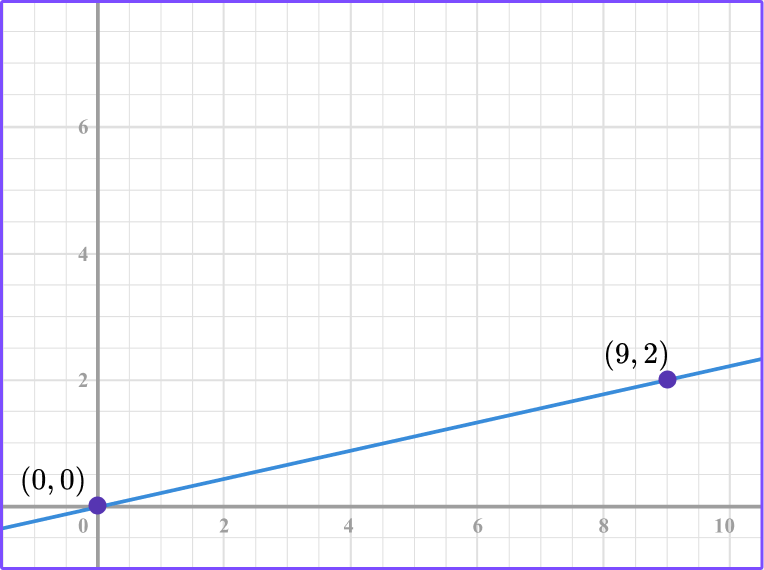
From the graph you can see that the line passes through (0, 0) and (9, 2).
Using the point (9, 2) , the ratio of the point in the form of \, \cfrac{y}{x} \, is \, \cfrac{2}{9} \, .
Another way to interpret the constant of variation is to count from the origin to the point (9, 2).
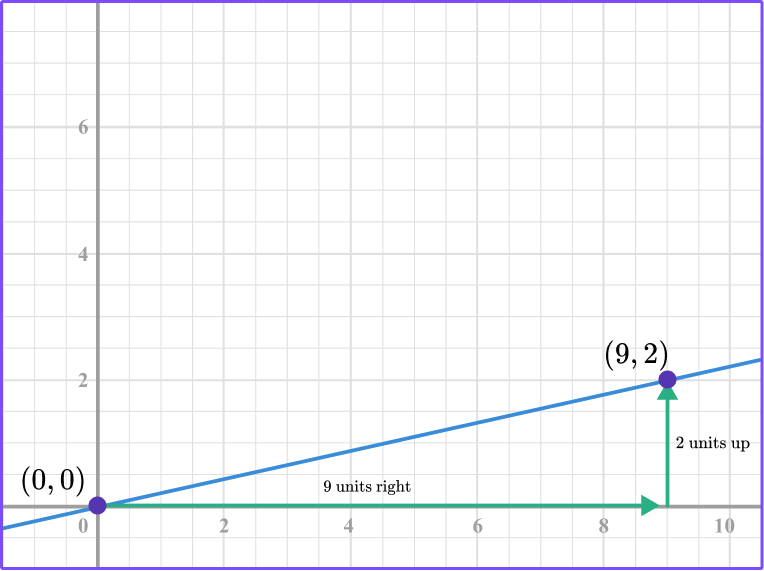
9 units right and 2 units up is the constant rate of \, \cfrac{2}{9} .
3. What is the constant rate of change of the direct variation graph?
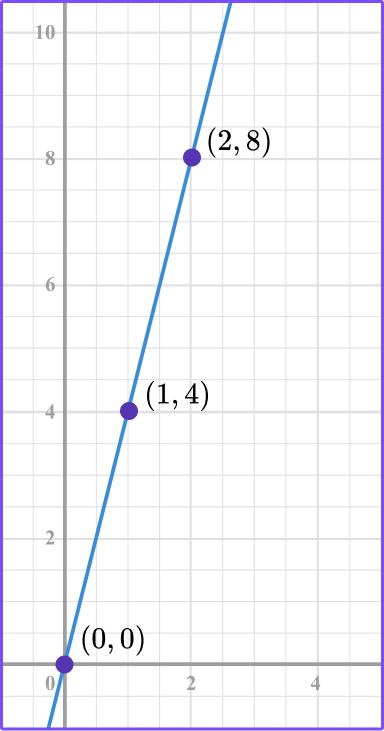
The constant rate of change is the constant of variation or the constant of proportionality.
Looking at the graph, the line passes through the points (0, 0), (1, 4) , and (2, 8).
Selecting the point (1, 4) , the ratio of the point in the form of \, \cfrac{y}{x} \, is \, \cfrac{4}{1} \, .
You can also count the movement from one point to the next to find the constant rate of change.
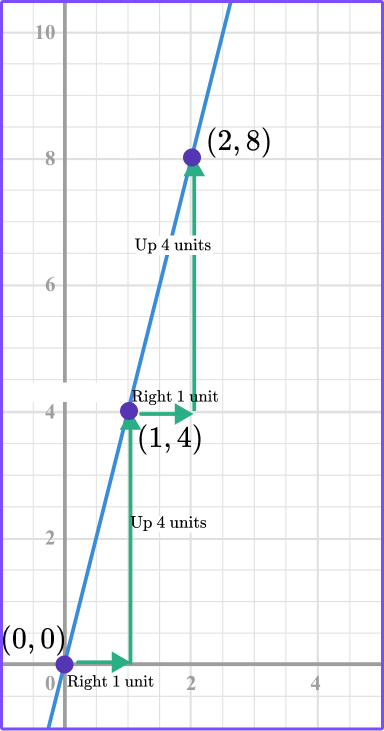
1 unit right and 4 units up \, \cfrac{4}{1} .
4. A rabbit can hop at top speed 6 miles in 10 minutes. This represents a proportional relationship as shown in the graph below. How long will it take the same rabbit to hop 12 miles at the same speed?
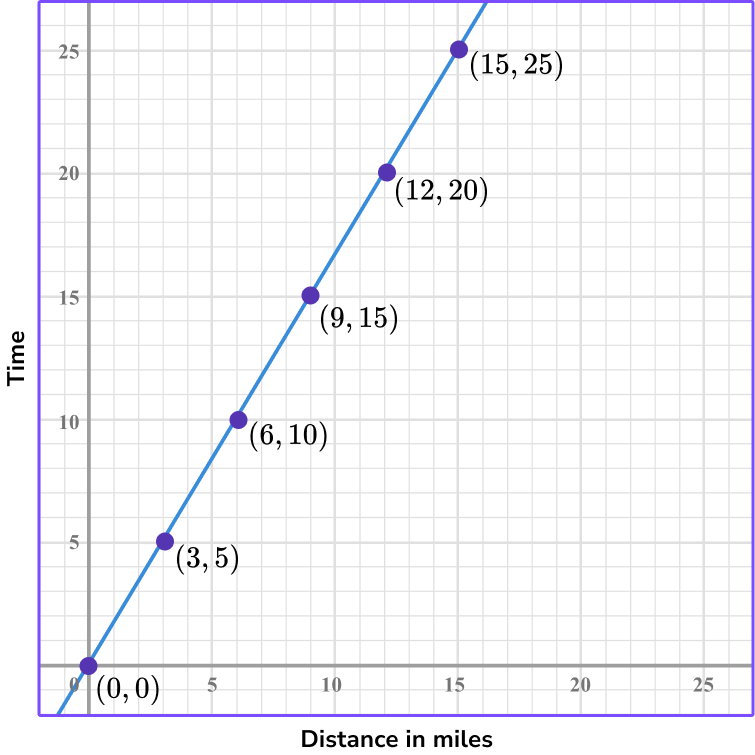
The point (6, 10) represents the rabbit hopping 6 miles in 10 minutes. Where x represents the distance and y represents the time.
Looking at the points, you can see that the coordinate (12, 20) represents 12 miles in 20 minutes.
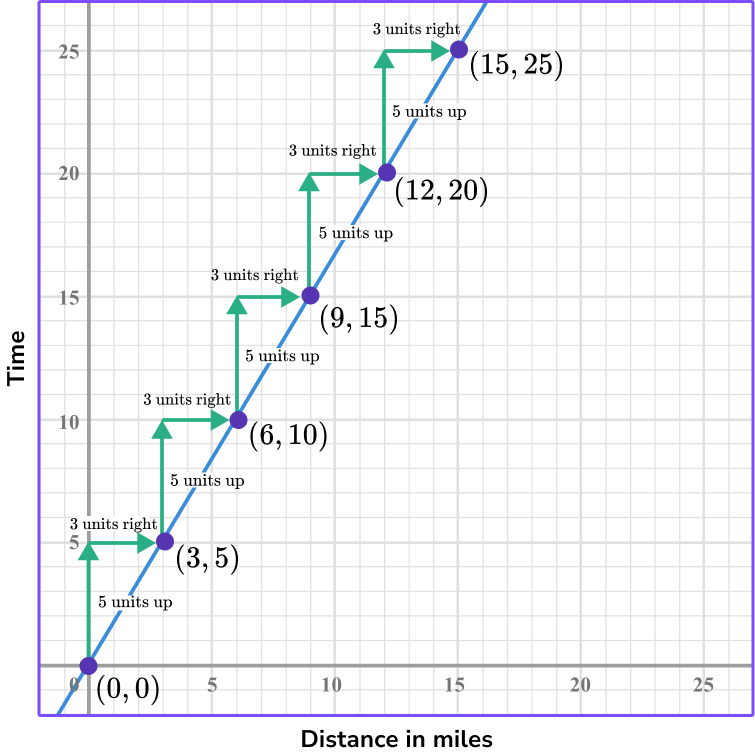
Another way to do it is to find the constant of variation.
The constant of variation is \, \cfrac{10}{6} \, which can be simplified to be \, \cfrac{5}{3} \, .
To find how long it will take the rabbit to hop 12 miles you can multiply 12 \times \cfrac{5}{3}=20 or use the graph and count out the constant of variation 5 units up and 3 units right until you get to the point where 12 is the x -coordinate.
5. If x and y vary directly, find the equation of direct variation that contains the point (2, 8).
Using the direct variation equation y=kx and the given point, (2, 8), you can substitute x with 2 and y with 8.
8=k(2) and then solve for k.
\begin{aligned} &8=k(2)\\\\ &\cfrac{8}{2}=\cfrac{k \, (2)}{2} \\\\ &4=k \end{aligned}
Since k=4, the equation will be y=4 x .
6. If x and y vary directly, find the equation of direct variation that contains the point (-6, 12).
Using the direct variation equation y=kx and the given point, (-6, 12), you can substitute x with -6 and y with 12.
12=k \cdot(-6) and then solve for k.
\begin{aligned} & 12=k(-6) \\\\ & \cfrac{12}{-6}=\cfrac{k \, (-6)}{-6} \\\\ & -2=k \end{aligned}
Since k=-2, the equation will be y=-2 k .
Direct variation FAQs
Yes, when you graph direct variation equations, they will go through the origin because direct variation equations are proportional.
Direct variation represents a direct proportion between the x variable and the y variable. When the x increases, the y increases, and vice versa.
The graph of a direct variation equation is a straight line that passes through the origin. With inverse variation, when the x increases, the y decreases, and vice versa. The graph of inverse variation is a curve.
Yes, the constant of variation represents the proportional relationship between x and y , where the vertical and horizontal movement from one point to the next is the same.
The constant rate of change of a line is the vertical and horizontal movement from one point to the next. In algebra, the constant rate of chance of a linear equation is the slope of a line.
Yes, the constant of variation can be a decimal or a fractional number.
The next lessons are
- Converting fractions decimals and percentages
- Percent
- Compound measure
Still stuck?
At Third Space Learning, we specialize in helping teachers and school leaders to provide personalized math support for more of their students through high-quality, online one-on-one math tutoring delivered by subject experts.
Each week, our tutors support thousands of students who are at risk of not meeting their grade-level expectations, and help accelerate their progress and boost their confidence.

Find out how we can help your students achieve success with our math tutoring programs.
[FREE] Common Core Practice Tests (3rd to 8th Grade)
Prepare for math tests in your state with these 3rd Grade to 8th Grade practice assessments for Common Core and state equivalents.
Get your 6 multiple choice practice tests with detailed answers to support test prep, created by US math teachers for US math teachers!