High Impact Tutoring Built By Math Experts
Personalized standards-aligned one-on-one math tutoring for schools and districts
In order to access this I need to be confident with:
Substitution Coordinate plane Linear graph Laws of exponentsCubic function graph
Here you will learn about cubic function graphs, including how to recognize them, how to sketch them and how to use them to estimate solutions.
Students will first learn about cubic function graphs as part of functions in high school.
What is a cubic function graph?
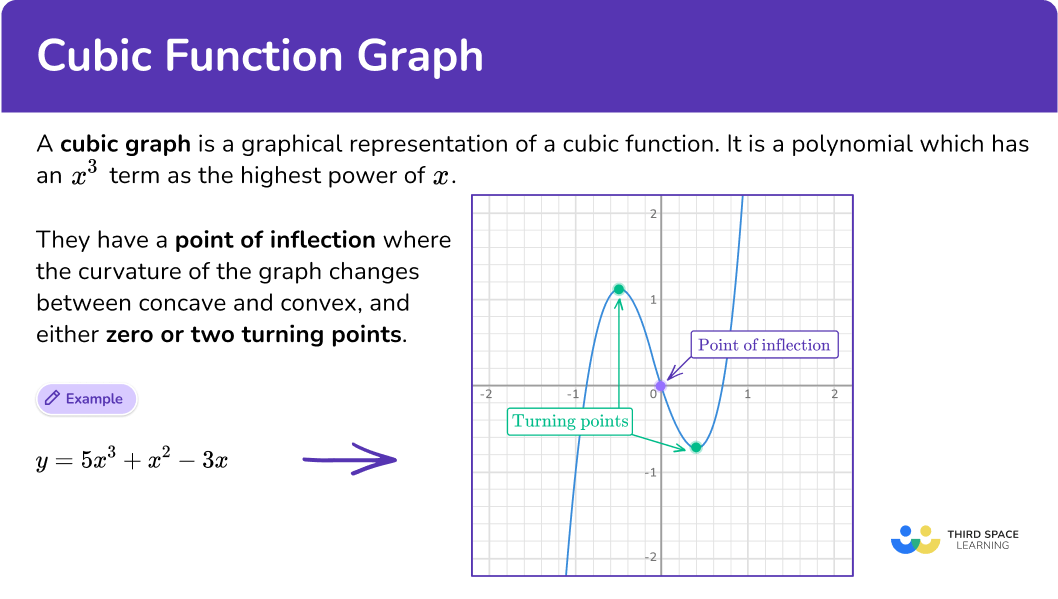
A cubic function graph is a graphical representation of a cubic function.
A cubic is a polynomial which has an x^3 term as the highest power of x.
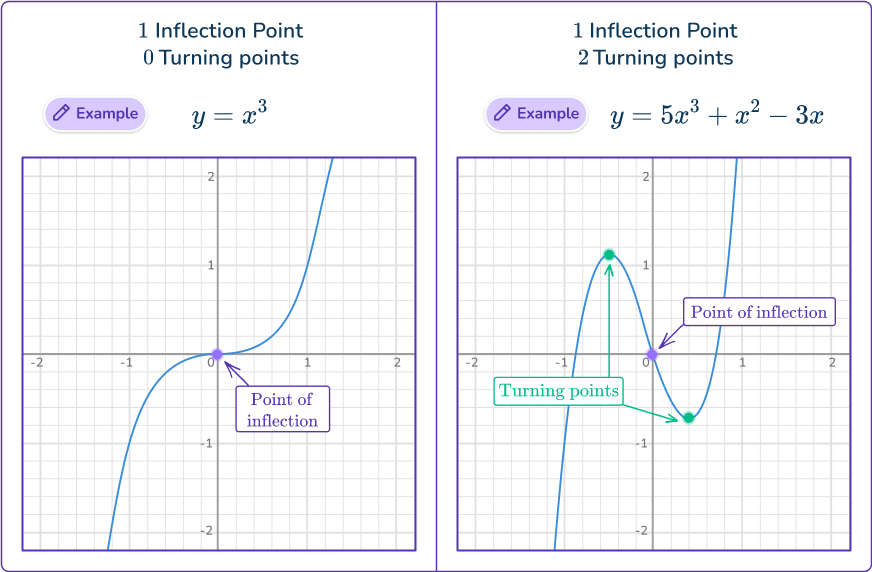
These graphs have:
- a point of inflection where the curvature of the graph changes between concave and convex
- either zero or two turning points (also referred to as critical points or local minimum/maximum)
A cubic graph with two turning points can touch or cross the x axis between one and three times.
The end behavior describes y as x approaches infinity or negative infinity. Cubic function graphs that are increasing have y values that increase as x increases.
For example,
In the graph below, the leading coefficient of the x^3 term is positive, so the graph increases.
y=x^{3}-2x^{2}-x+2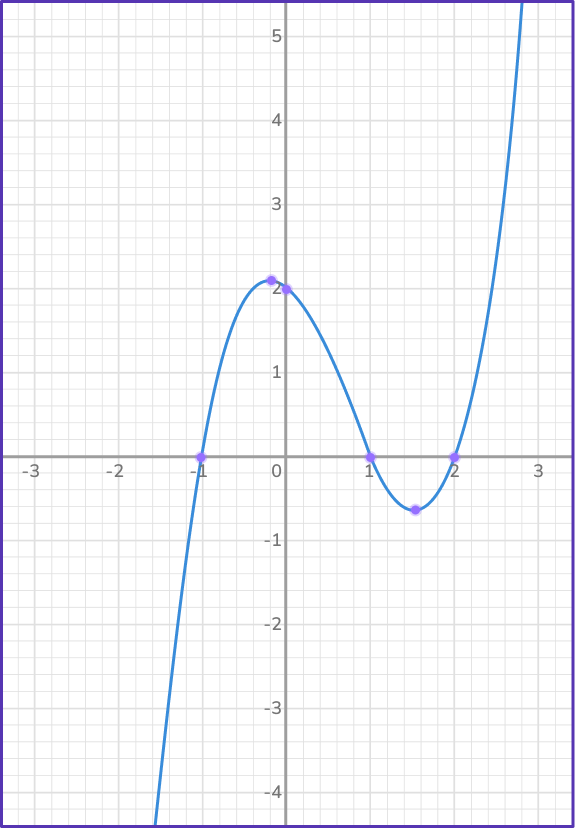
Also notice, the y -intercept of the curve is + \, 2 and the equation ends with + \, 2 for when x=0.
Cubic function graphs that are decreasing have y values that decrease as x increases.
For example,
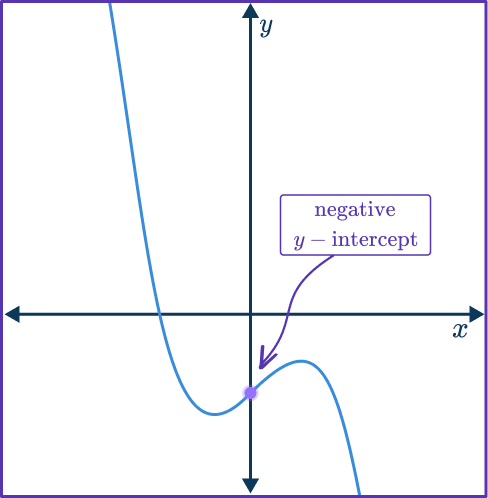
In the graph below, the leading coefficient of the x^3 term is negative, so the graph decreases.
y=- \, x^{3}+2x^{2}+x-2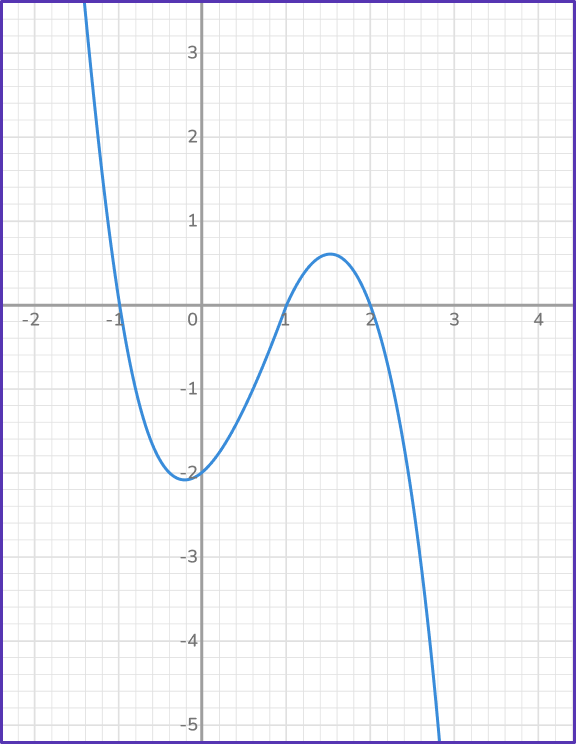
Also notice, the y -intercept of the curve is - \, 2 and the equation ends with - \, 2 for when x=0.
What is a cubic function graph?
Common Core State Standards
How does this relate to high school math?
- Interpreting Functions (HS.F.IF.C.7)
Graph functions expressed symbolically and show key features of the graph, by hand in simple cases and using technology for more complicated cases.
![[FREE] Cubic Graphs Worksheet (High School)](https://thirdspacelearning.com/wp-content/uploads/2024/03/Cubic-Graphs-Worksheet-listing-image.png)
[FREE] Cubic Graphs Worksheet (High School)
![[FREE] Cubic Graphs Worksheet (High School)](https://thirdspacelearning.com/wp-content/uploads/2024/03/Cubic-Graphs-Worksheet-listing-image.png)
Use this worksheet to check your high school students’ understanding of cubic graphs. 15 questions with answers to identify areas of strength and support!
DOWNLOAD FREE![[FREE] Cubic Graphs Worksheet (High School)](https://thirdspacelearning.com/wp-content/uploads/2024/03/Cubic-Graphs-Worksheet-listing-image.png)
[FREE] Cubic Graphs Worksheet (High School)
![[FREE] Cubic Graphs Worksheet (High School)](https://thirdspacelearning.com/wp-content/uploads/2024/03/Cubic-Graphs-Worksheet-listing-image.png)
Use this worksheet to check your high school students’ understanding of cubic graphs. 15 questions with answers to identify areas of strength and support!
DOWNLOAD FREEHow to identify a cubic graph
In order to match a cubic function graph to its equation:
- Identify any linear, quadratic or other type of function.
- Identify the coefficient of the \textbf{x}\bf{^3} term as positive or negative.
- Identify your final answer.
Identifying a cubic graph examples
Example 1: recognizing cubic graphs
Identify the correct graph for the equation:
y=x^3+2x^2+7x+4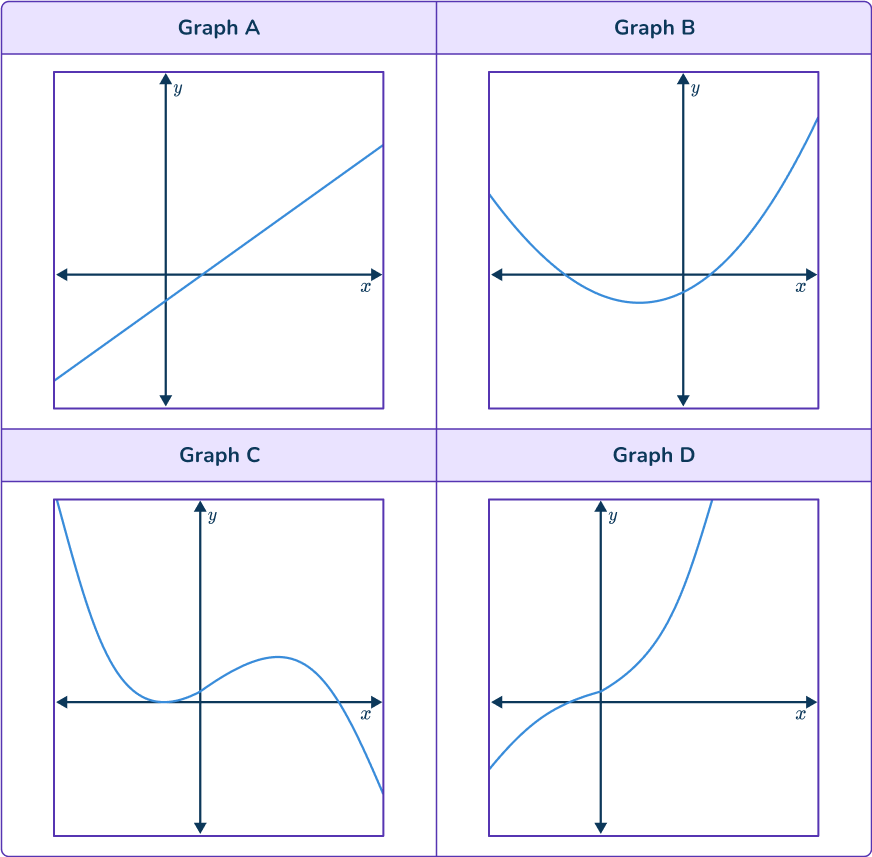
- Identify any linear, quadratic or other type of function.
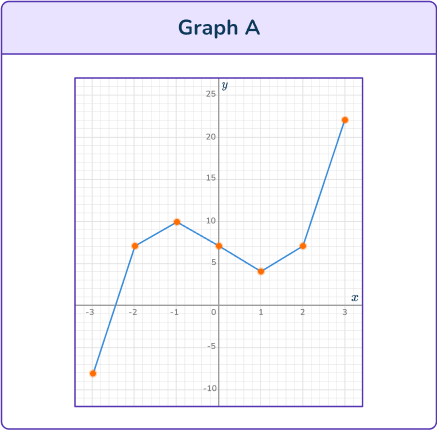
Graph A is a straight line – it is a linear function.
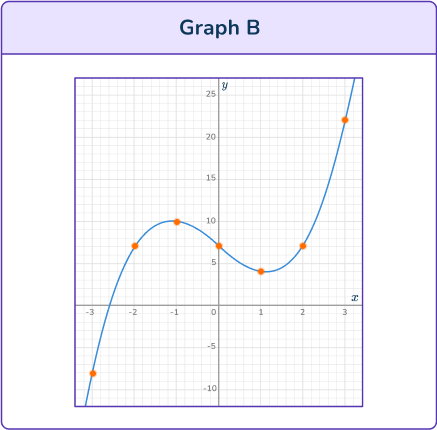
Graph B is a parabola – it is a quadratic function.
Neither Graph A or Graph B is a cubic function.
2Identify the coefficient of the \textbf{x}\bf{^3} term as positive or negative.
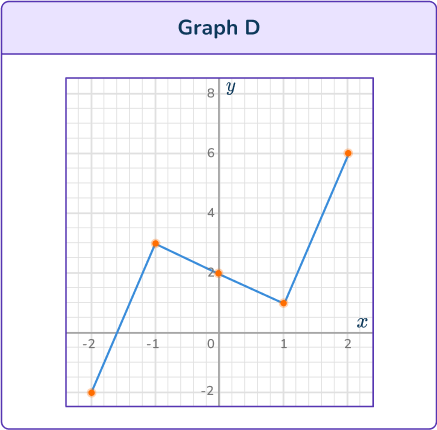
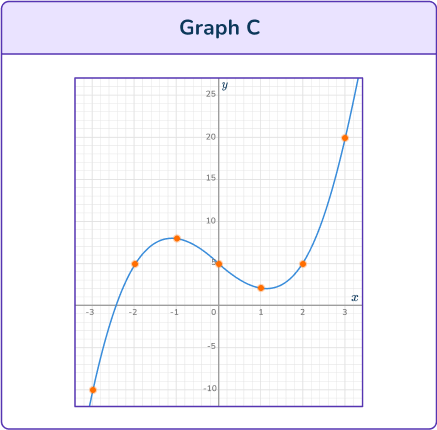
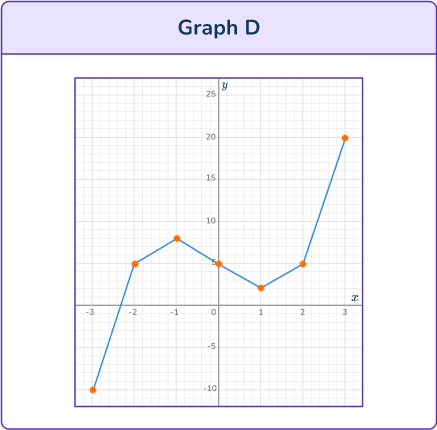
Graph C and Graph D could be cubic functions. They have two turning points.
The given equation has a positive x^3 term.
For Graph C the graph decreases, so Graph C cannot be the correct graph.
Graph D is increasing.
3Identify your final answer.
Graph D is the correct graph for the equation.
Example 2: recognizing cubic graphs
Identify the correct graph for the equation:
y=- \, x^3+2x^2+4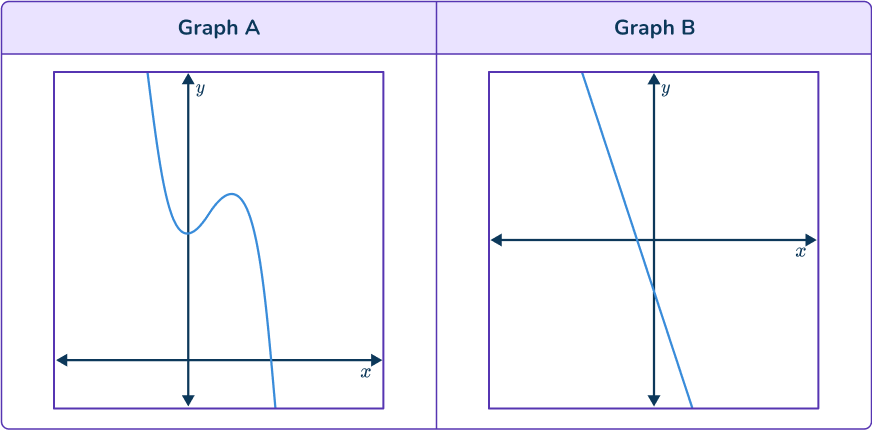
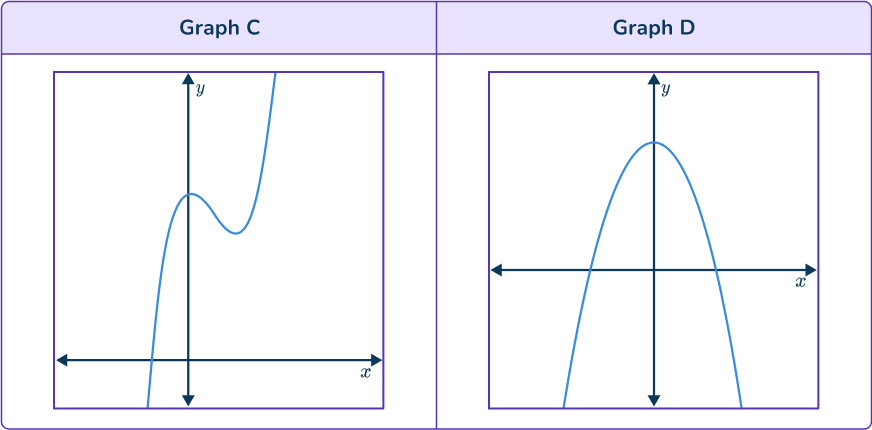
Identify any linear, quadratic or other type of function.
Graph B is a straight line – it is a linear function.
Graph D is a parabola – it is a quadratic function.
Neither Graph B or Graph D is a cubic function.
Identify the coefficient of the \textbf{x}\bf{^3} term as positive or negative.
Graph A and Graph C could be cubic functions. They have two turning points.
The given equation has a negative x^3 term so the graph will decrease.
Graph C is increasing, so Graph C can not be the correct graph.
Graph A is decreasing.
Identify your final answer.
Graph A is the correct graph for the equation.
How to sketch a cubic function graph from cubic equations
In order to plot a cubic function graph from cubic equations:
- Complete the table of values.
- Plot the coordinates.
- Draw a smooth curve through the points.
Example 3: sketching a cubic function graph
Draw the curve of the equation for - \, 2\leq{x}\leq2.
y=x^{3}-3x-1Complete the table of values.
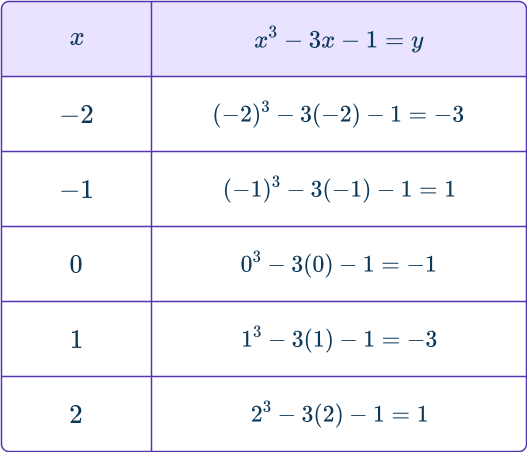
Plot the coordinates.
Draw an x -axis and y -axis or use a pre-made coordinate grid. Plot the coordinates:
(– \, 2, – \, 3); \, (– \, 1, 1); \, (0, – \, 1); \, (1, – \, 3); \, (2, 1).
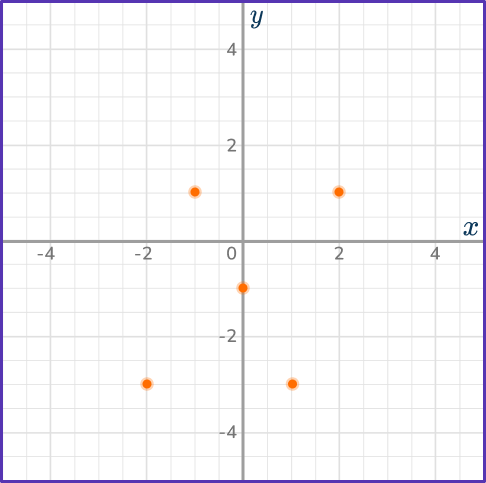
Draw a smooth curve through the points.
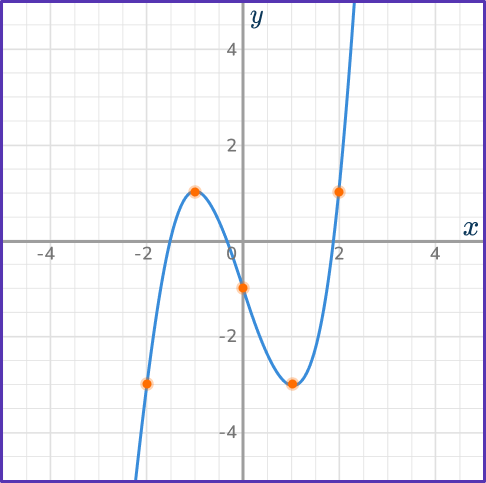
The y -intercept of the curve is - \, 1 and appears to be the inflection point. Based on the other points, you can infer that the points (– \, 1, 1) and (1, – \, 3) are turning points.
To calculate the exact turning points, you can set the derivative equal to 0. But note that this strategy is not modeled on this page.
Example 4: sketching a cubic function graph
Draw the curve of the equation for - \, 3\leq{x}\leq3
y=x^3-6x+1Complete the table of values.
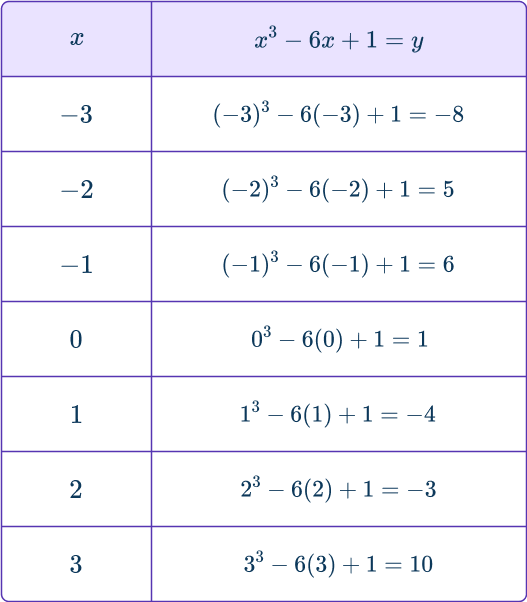
Plot the coordinates.
Draw an x -axis and y -axis or use a pre-made coordinate grid. Plot the coordinates:
(– \, 3, – \, 8); \, (– \, 2, 5); \, (– \, 1, 6); \, (0, 1); \, (1, – \, 4); \, (2, – \, 3); \, (3, 10).
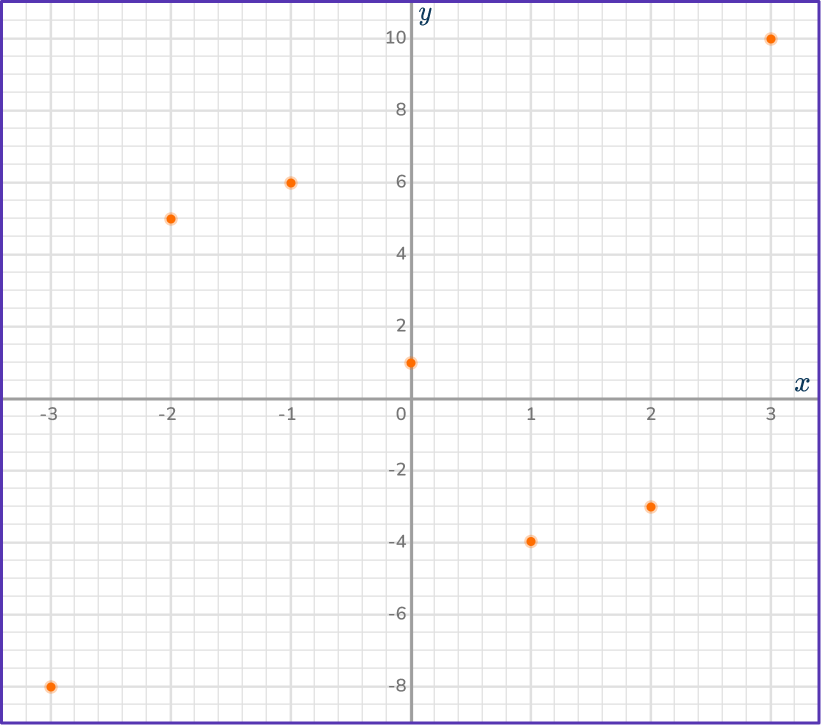
Draw a smooth curve through the points.
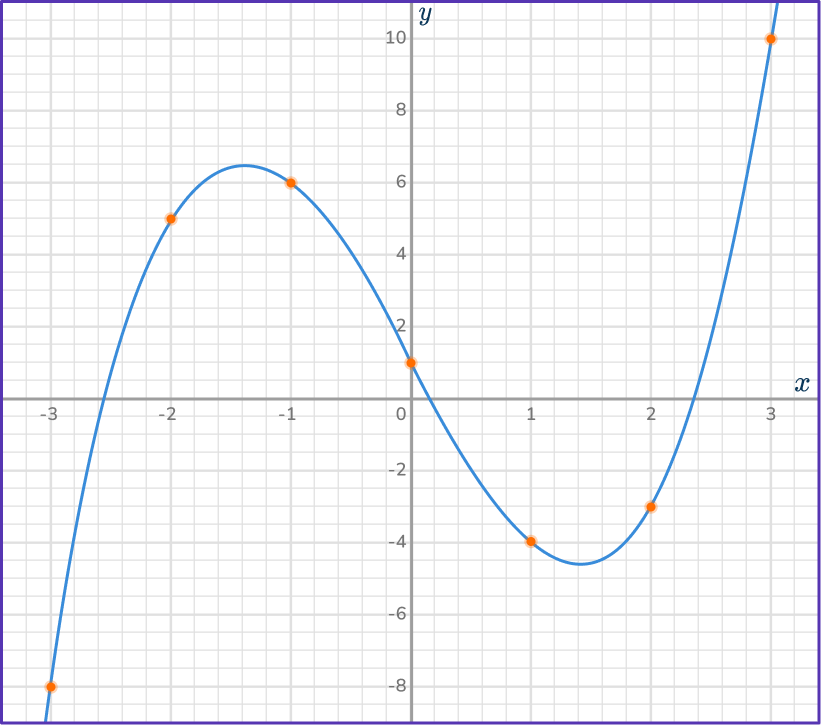
The y -intercept of the curve is + \, 1 and appears to be the inflection point. Based on the other points, you can infer that the turning points are between (– \, 2, 5) and (– \, 1, 6) and (1, – \, 4) and (2, – \, 3).
To calculate the exact turning points, you can set the derivative equal to 0. But note that this strategy is not modeled on this page.
How to use a cubic function graph to estimate solutions
In order to use a cubic function graph to estimate solutions:
- Find the given value on the \textbf{y} -axis.
- Draw a straight horizontal line across the curve.
- Draw a straight vertical line from the curve to the \textbf{x} -axis.
- Read off the value on the \textbf{x} -axis.
Example 5: estimate the solution using a cubic function graph
Use the graph of y=x^3-5x+1 to find an approximate solution of the equation
x^3-5x+1=6.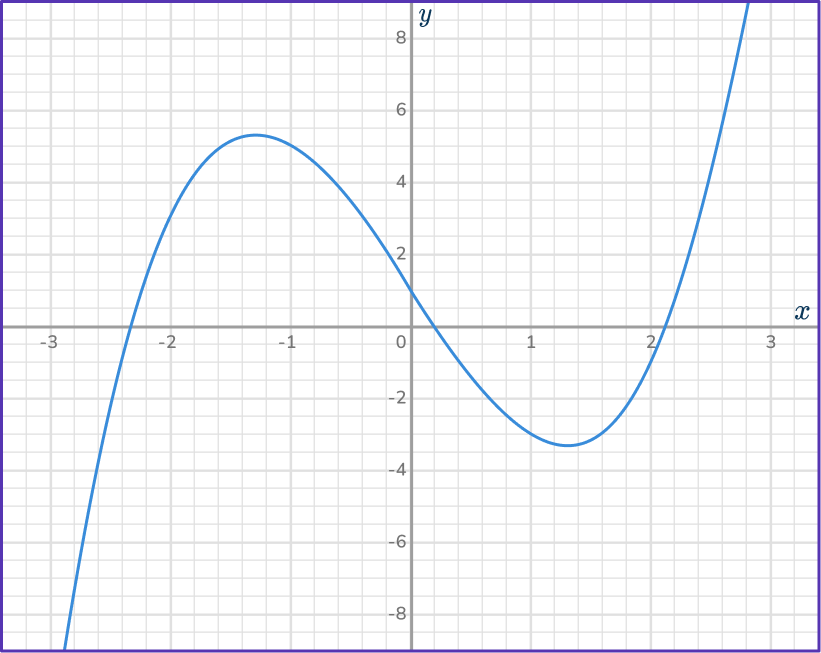
Find the given value on the \textbf{y} -axis.
The value of 6 is in place of the y. Look on the y -axis for the value of 6.
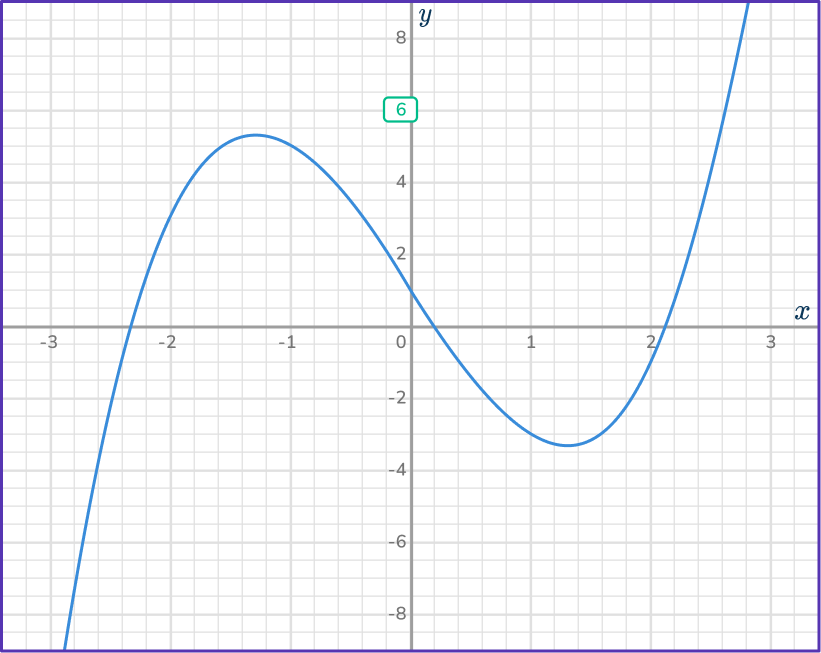
Draw a straight horizontal line across the curve.
Use a digital tool or ruler to be as accurate as possible.
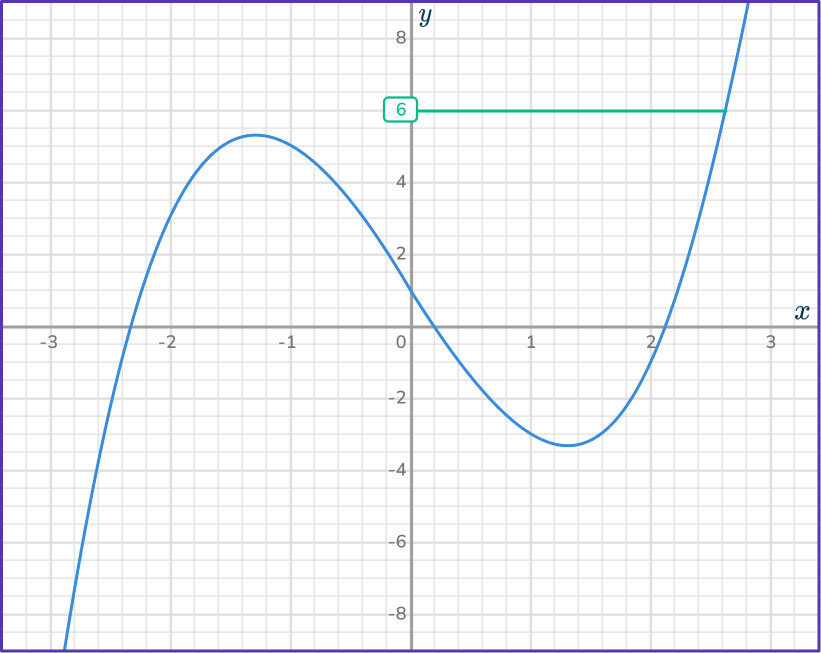
Draw a straight vertical line from the curve to the \textbf{x} -axis.
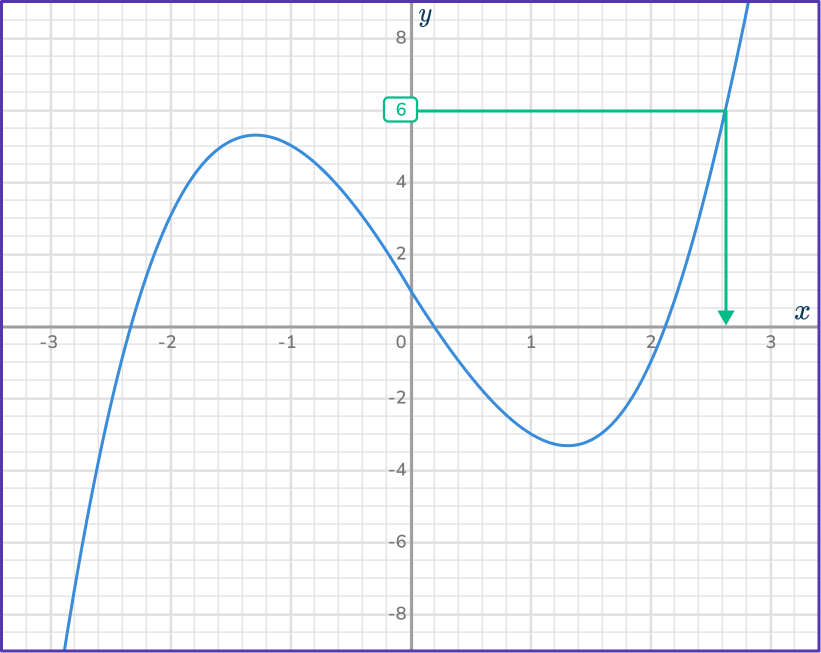
Read off the value on the \textbf{x} -axis.
Be careful with the scale on x -axis. The solution to the equation is only approximate, but try to be as accurate as you can.
x=2.6
You could substitute the x value back into the original equation to check.
Example 6: estimate the solution using a cubic function graph
Use the graph of y=x^3-7x-3 to find approximate solutions of the equation
x^3-7x-3=2.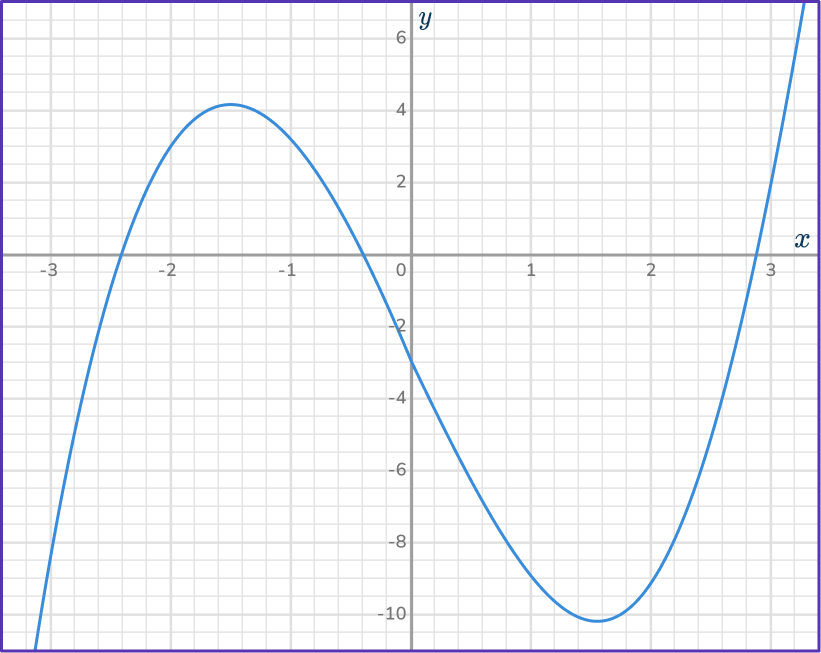
Find the given value on the \textbf{y} -axis.
The value of 2 is in place of the y. Look on the y -axis for the value of 2.
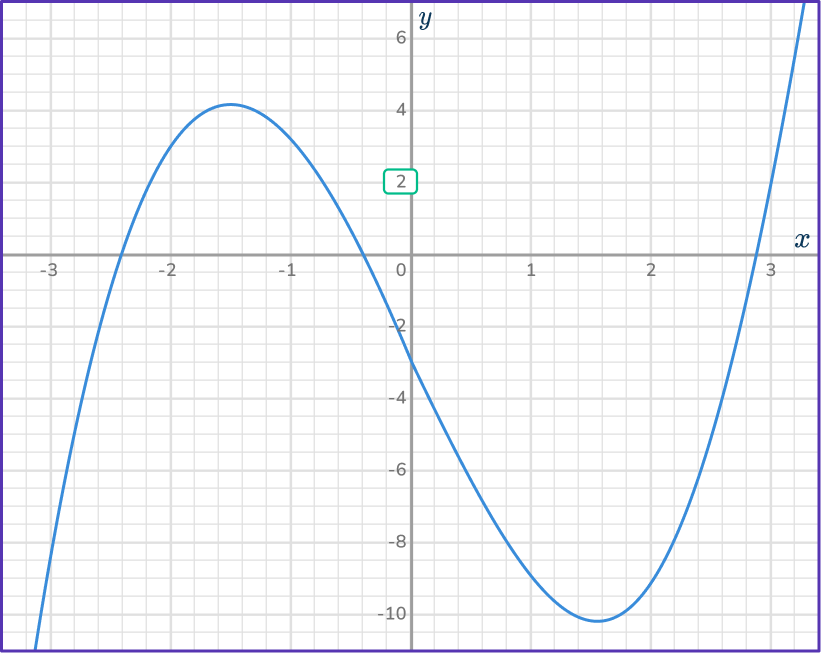
Draw a straight horizontal line across the curve.
Use a digital tool or ruler to be as accurate as possible. The horizontal line cuts the curve in 3 places.
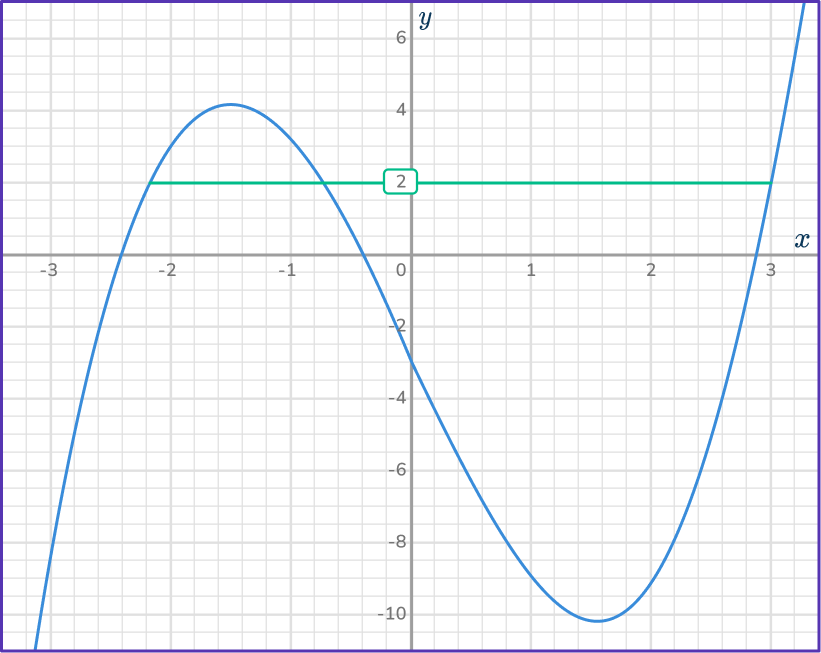
Draw a straight vertical line from the curve to the \textbf{x} -axis.
There are 3 vertical lines required here.
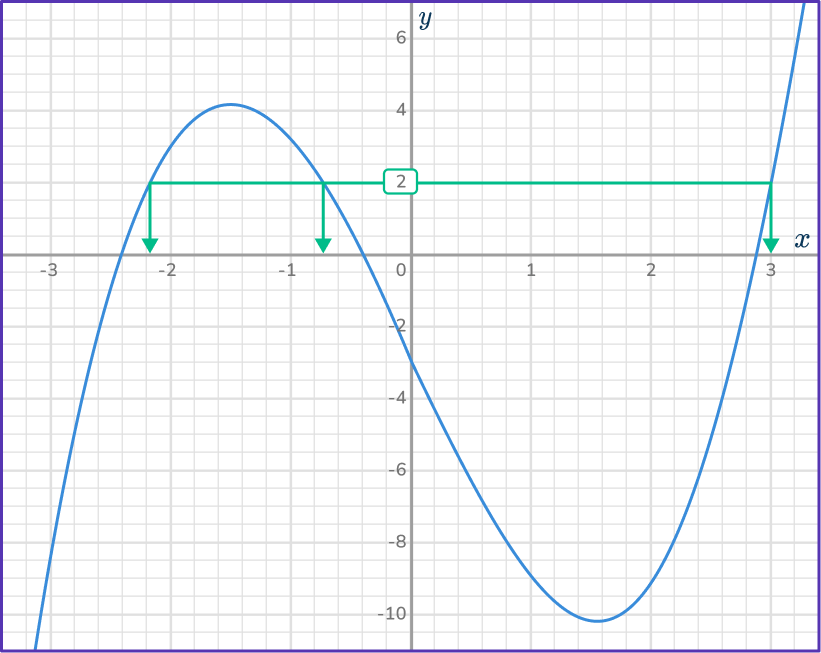
Read off the value on the \textbf{x} -axis.
Be careful with the scale on x -axis. There are three x values to read off. The solutions to the equation are only approximate, but try to be as accurate as you can.
x=- \, 2.2, \, - \, 0.8 and 2.9
Teaching tips for cubic function graph
- Before graphing cubic functions, students should be familiar with the coordinate plane and have experience graphing linear equations.
- Give students opportunities to compare cubic function graphs to graphs of other polynomial functions, asking them to share what they notice and wonder.
- Let struggling students use the step-by-step guides given above, until they feel comfortable with the material.
Easy mistakes to make
- Not paying attention to the scale on the \textbf{x} and \textbf{y} axis
Cubic graphs often have different scales on the x -axis and the y -axis. Always pay close attention to this when you are plotting coordinates.
- Incorrectly calculating with exponents
When using an equation to sketch a graph, remember that the exponent indicates multiplication. It tells you how many times to multiply the variable by itself. So, x^3=x \cdot x \cdot x and x^2=x \cdot x.
- Not drawing a smooth cubic curve
The graph of the function needs to be drawn with a smooth curve. Avoid straight line segments for cubic function graphs. For example,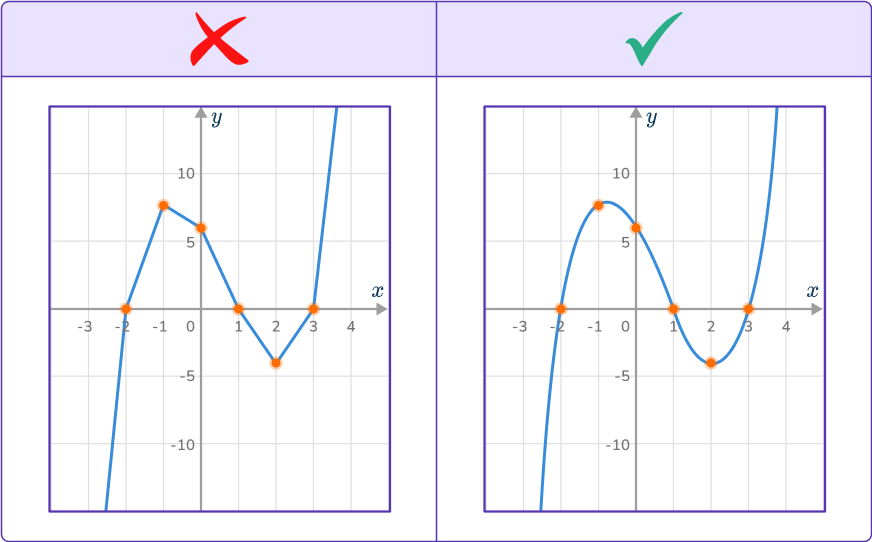
- Having more than \bf{2} turning points in the cubic function graph
Make sure that your cubic graph has only one local minimum point and one local maximum point (if it has 2 turning points). If it has more, check that you have the correct values and that you have plotted them correctly.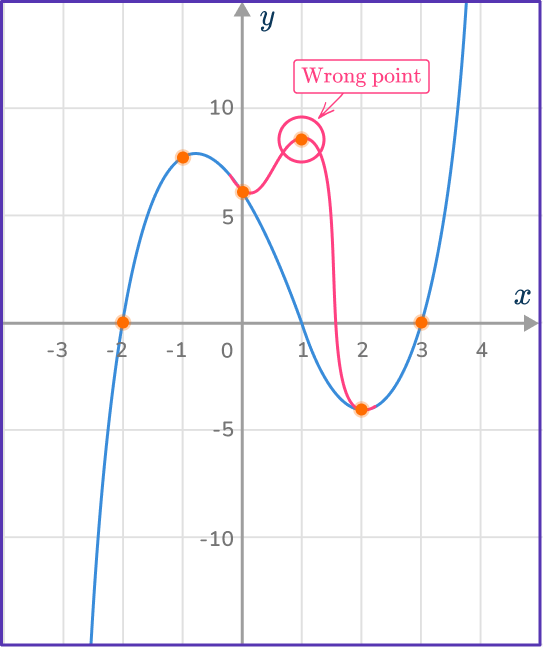
- Confusing a cubic equation with a quadratic equation
Some cubic equations include a term with x^2, but that does not make them quadratic equations.
For example,
Cubic equation: x^3+2 x^2+4 \hspace{1.5cm} Quadratic equation: 2 x^2+4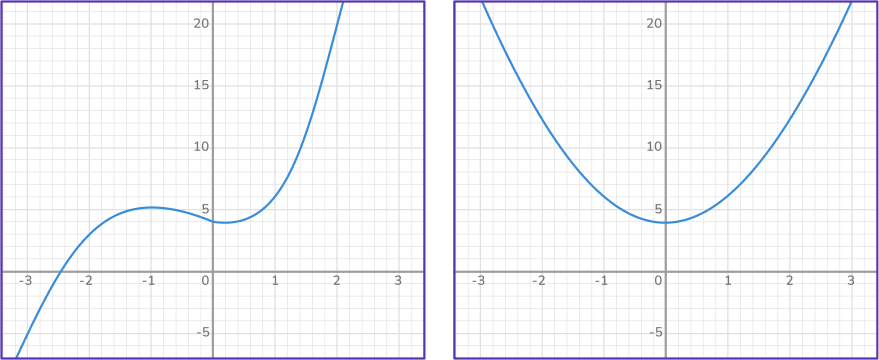
Related types of graphs lessons
Practice cubic function graph questions
1. Identify the correct graph for the equation:
y=x^3-3x+2
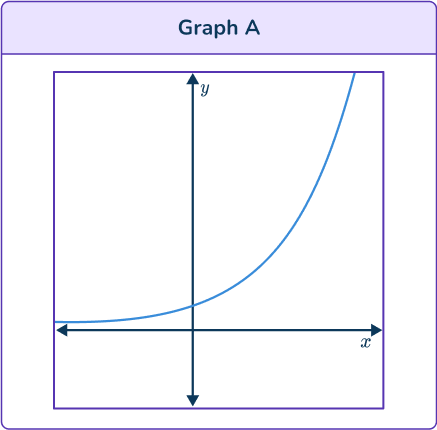




Graph A is a growth curve so is an exponential function.
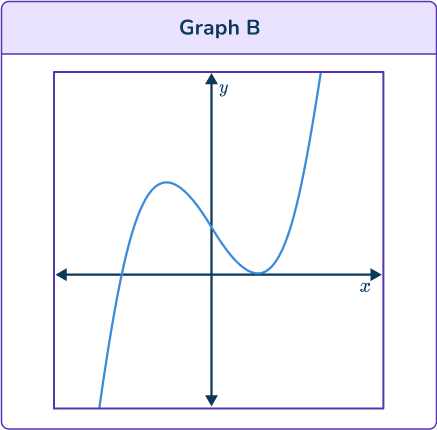
Graph B has 2 turning points so could be the graph of a cubic function.
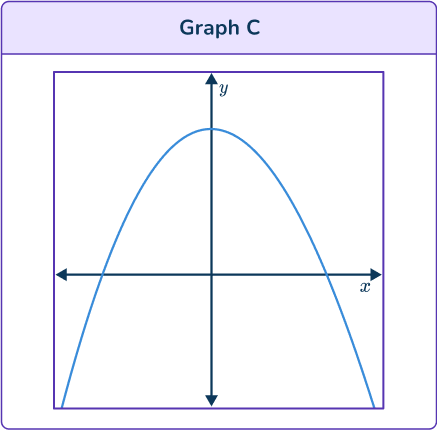
Graph C is a parabola so is a quadratic function.
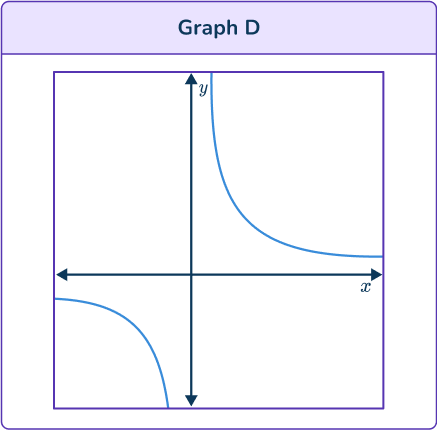
Graph D is a hyperbola so is a reciprocal function.
Graph B is the only curve which could be a cubic function. It is also correct because the y -intercept is positive on the curve and the equation. Also, the leading coefficient in the equation is positive, so the cubic function graph should be increasing.
2. Identify the correct graph for the equation:
y=- \, x^3+2x-3
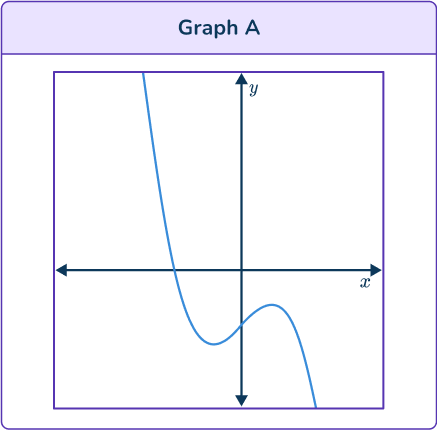

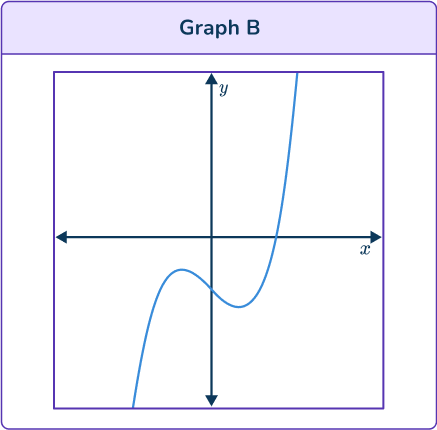

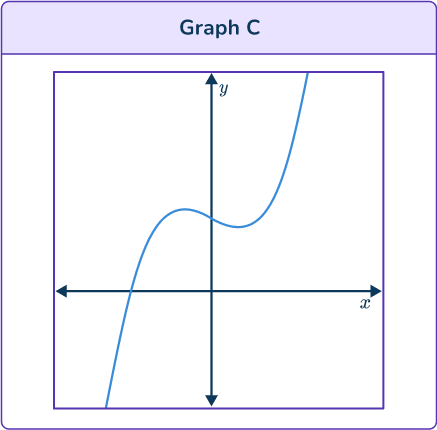

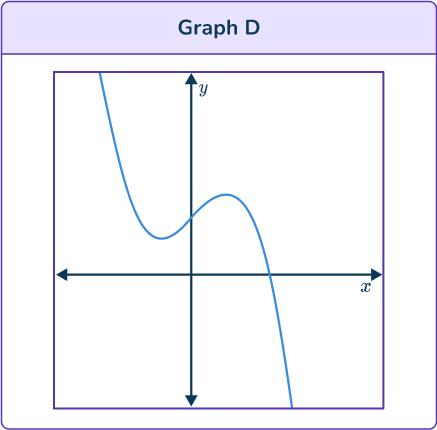

All graphs have two turning points so all the graphs could be graphs of cubic functions.
Graph B and Graph C show that as x increases so does y too, so their equation has a positive x^3 term. The equation given has a negative x^3 term. So, the correct graph is not one of these.
Graph A and Graph D show that as x increases y decreases, so their equation has a negative x^3 term.
But the y intercept on Graph A is negative, and the given equation ends with – \, 3 so this is the correct graph.
3. Identify the correct graph for the equation:
y=x^{3}-2x+3
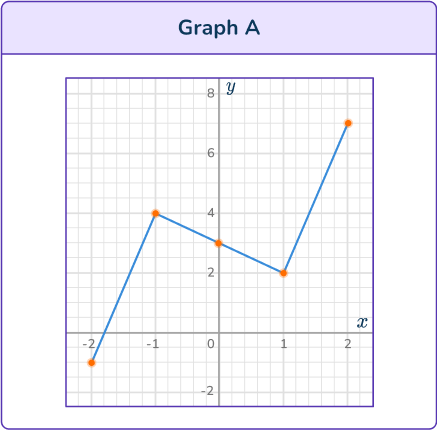

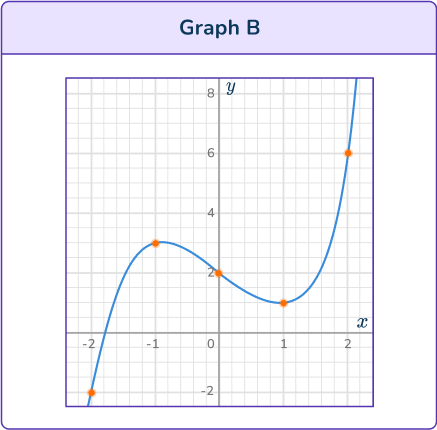

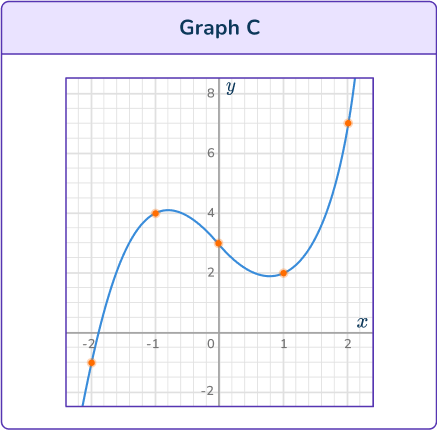


Substitute values for x into the equation y=x^3-2 x+3. Try values around the origin first, to see if you can estimate the turning points and inflection point.
A correct table of values would be:

Plot the points on a coordinate plane. Draw a smooth curve through the points.
4. Identify the correct graph for the equation:
y=x^3-4x+5




Substitute values for x into the equation y=x^3-4 x+5. Try values around the origin first, to see if you can estimate the turning points and inflection point.
A correct table of values would be:

Plot the points on a coordinate plane. Draw a smooth curve through the points.
5. Use the graph of y=6+3x-x^3 to solve:
6+3x-x^3=2
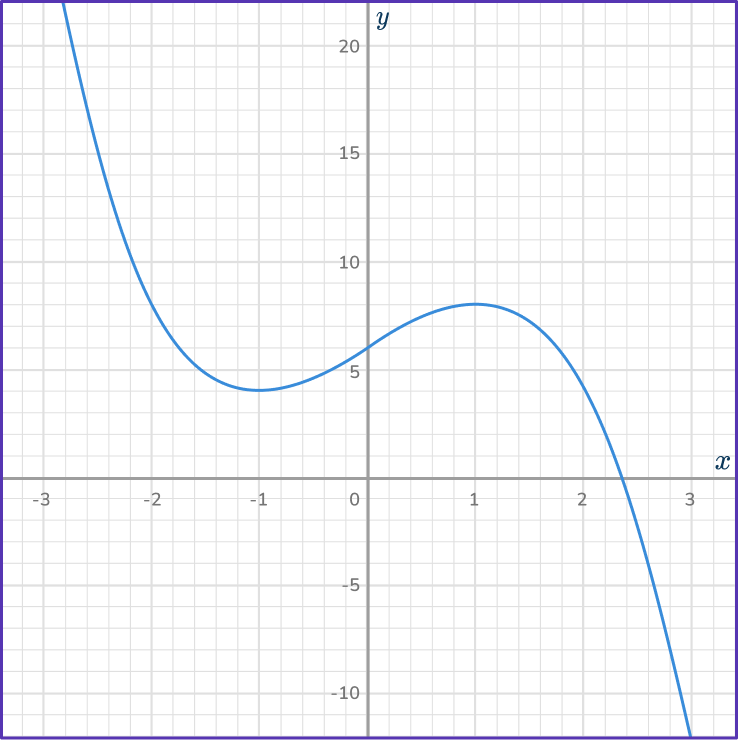


First, draw a straight horizontal line across the curve. Use a digital tool or ruler to be as accurate as possible.
Then, draw a vertical line from the curve to the x -axis.
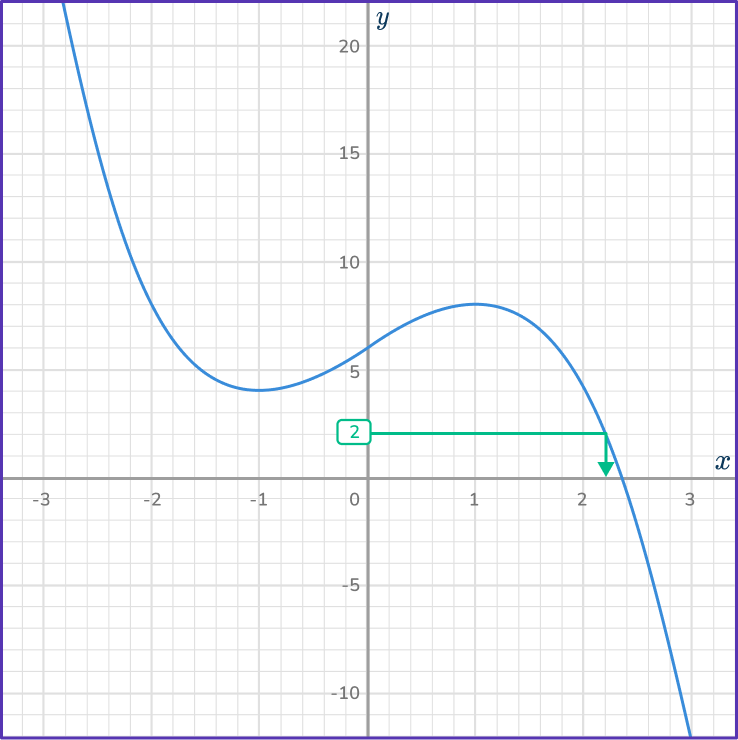
Estimate the x value. It seems to fall a little after 2, but before 2.5. This makes the answer choice 2.2 correct.
6. Use the graph of y=x^3-3x+7 to solve:
x^3-3x+7=4
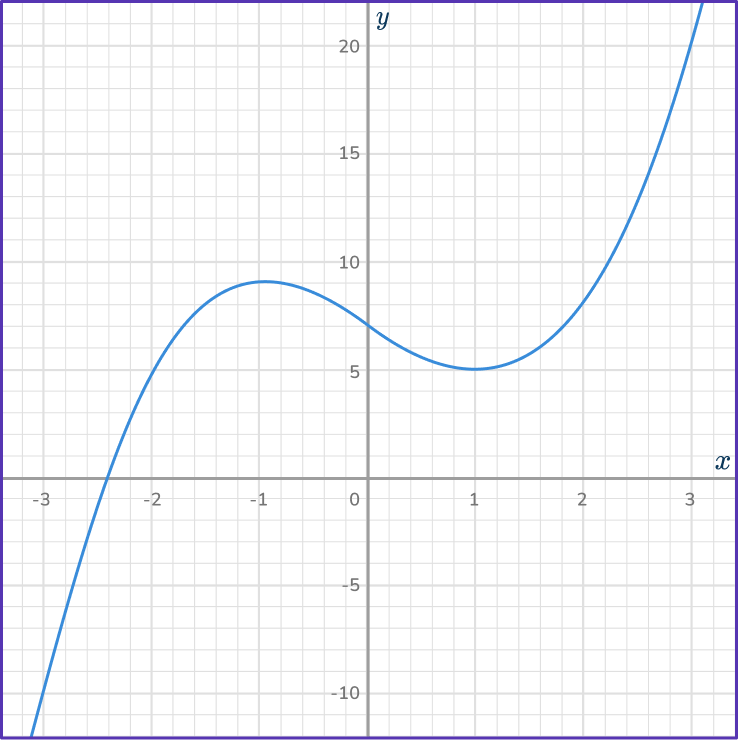


First, draw a straight horizontal line across the curve. Use a digital tool or ruler to be as accurate as possible.
Then, draw a vertical line from the curve to the x -axis.
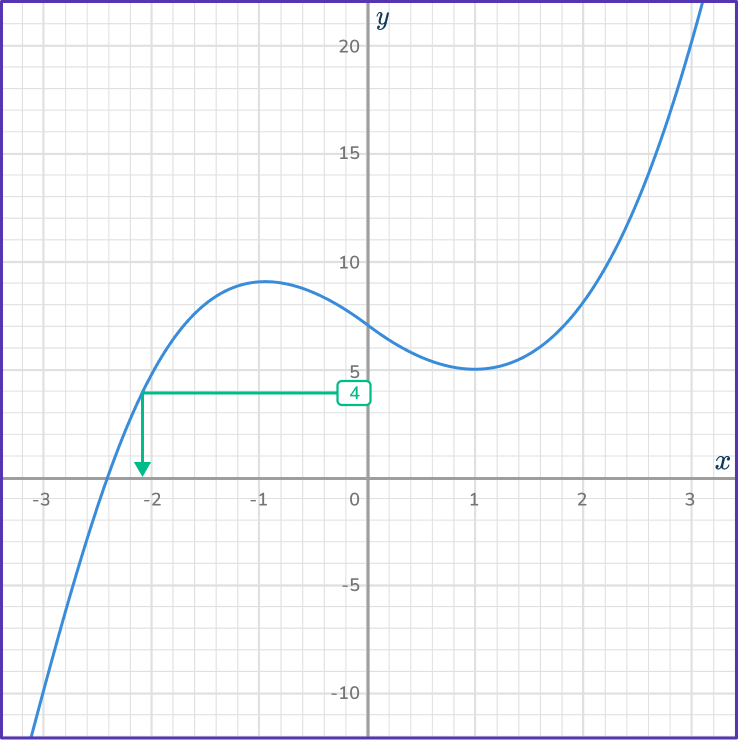
Estimate the x value. It seems to fall in between – \, 3 and – \, 2, but close to – \, 2. This makes the answer choice – \, 2.1 correct.
Cubic function graph FAQs
Cubic function graphs contain sets of real numbers, unless otherwise specified.
A polynomial whose highest power is 3.
The next lessons are
- Graphing linear equations
- Rate of change
- System of equations
Still stuck?
At Third Space Learning, we specialize in helping teachers and school leaders to provide personalized math support for more of their students through high-quality, online one-on-one math tutoring delivered by subject experts.
Each week, our tutors support thousands of students who are at risk of not meeting their grade-level expectations, and help accelerate their progress and boost their confidence.

Find out how we can help your students achieve success with our math tutoring programs.
[FREE] Common Core Practice Tests (3rd to 8th Grade)
Prepare for math tests in your state with these 3rd Grade to 8th Grade practice assessments for Common Core and state equivalents.
Get your 6 multiple choice practice tests with detailed answers to support test prep, created by US math teachers for US math teachers!