High Impact Tutoring Built By Math Experts
Personalized standards-aligned one-on-one math tutoring for schools and districts
In order to access this I need to be confident with:
What is proportion in math Ratios Unit rate math Constant of proportionality Equivalent fractionsDirect variation equation
Here you will learn about direct variation, including the direct variation equation, the constant of variation, and the graph of a direct variation equation. You will also learn how to solve problems using direct variation.
Students first learn about direct variation in grade 7 when they learn about the constant of proportionality and expand their knowledge as they move through 8 th grade math and Algebra 1.
What is direct variation equation?
The direct variation equation (or direct variation formula) shows a proportional relationship between two variables where one is a constant multiple of another. This means that an increase in one of the variables results in a proportional increase in the other, or as x increases, y increases at a constant rate.
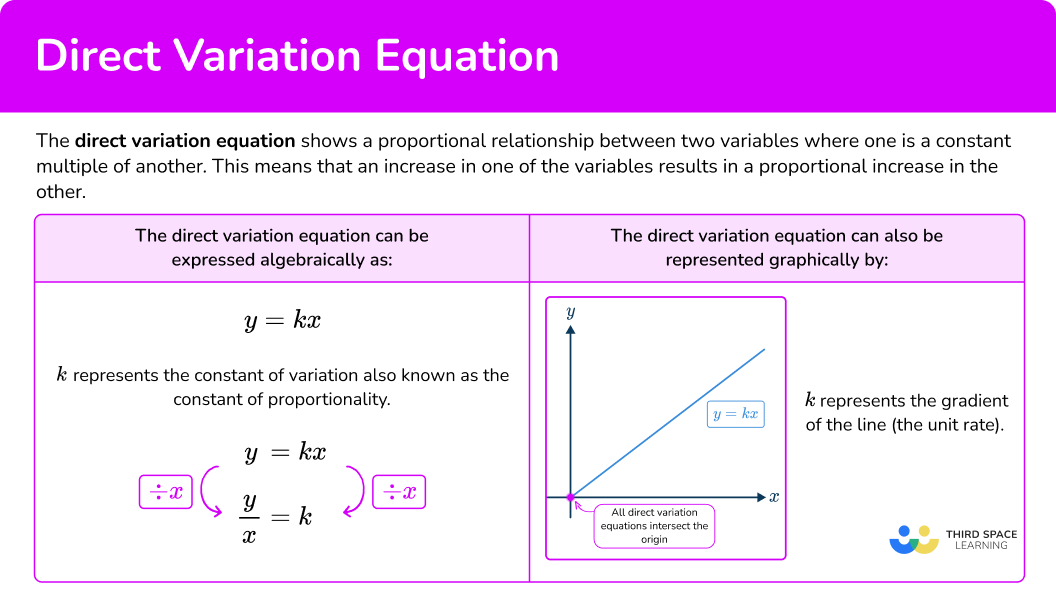
The direct variation equation can be expressed algebraically as:
y=kxThis means that y is directly proportional to x where k is the constant of variation or the constant of proportionality. k is a constant value that links the two variables, for example, if k=2 then y would be double the value of x for every value of x.
The direct variation equation can also be represented by a graph.
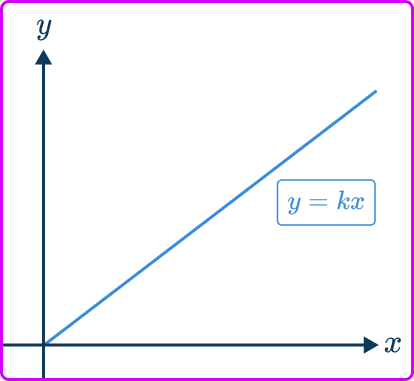
Direct variation is a straight line graph going through the origin where the constant of variation or slope of the line is k.
The value of k can be found by rearranging y=kx so k=\cfrac{y}{x}.
The constant of proportionality also represents the unit rate.
What is direct variation equation?
Common Core State Standards
How does this apply to middle school math?
- Grade – 7 Ratios and Proportional Relationships (7.RP.A.2b)
Identify the constant of proportionality (unit rate) in tables, graphs, equations, diagrams, and verbal descriptions of proportional relationships.
- Grade – 8 Expressions and Equations (8.EE.B.5)
Graph proportional relationships, interpreting the unit rate as the slope of the graph. Compare two different proportional relationships represented in different ways.
![[FREE] Direct Variation Worksheet (Grade 7 and 8)](https://thirdspacelearning.com/wp-content/uploads/2024/10/Direct-Variation-Worksheet-listing-image.png)
[FREE] Direct Variation Worksheet (Grade 7 and 8)
Use this worksheet to check your 7th and 8th grade students’ understanding of direct variation. 15 questions with answers to identify areas of strength and support!
DOWNLOAD FREE [FREE] Direct Variation Worksheet (Grade 7 and 8)
Use this worksheet to check your 7th and 8th grade students’ understanding of direct variation. 15 questions with answers to identify areas of strength and support!
DOWNLOAD FREEHow to write a direct variation equation
In order to write a direct variation equation:
- Calculate the constant of variation, \textbf{k}.
- Write the equation in the form of \textbf{y = kx}.
Examples of direct variation equation
Example 1: write direct variation equation
If x and y vary directly, write the direct variation equation when x=4 and y=16.
- Calculate the constant of variation, \textbf{k}.
To calculate k, use the direct variation equation, y=kx.
y=kx can also be written as k=\cfrac{y}{x}.
Substitute in 4 for x and 16 for y to calculate k.
\begin{aligned}k&=\cfrac{y}{x}=\cfrac{16}{4}=4 \\\\ k&=4 \end{aligned}The constant of variation k is 4.
2Write the equation in the form of \textbf{y = kx}.
The direct variation equation can be written by substituting 4 in for k.
y=4xExample 2: write a direct variation equation
If x and y vary directly, write the direct variation equation when x=7 and y=2.
To calculate k, use the direct variation equation, y=kx.
y=kx can also be written as k=\cfrac{y}{x}.
Substitute in 7 for x and 2 for y to calculate k.
\begin{aligned}k&=\cfrac{y}{x}=\cfrac{2}{7} \\\\
k&=\cfrac{2}{7} \end{aligned}
The constant of variation k is \cfrac{2}{7}.
The direct variation equation can be written by substituting \cfrac{2}{7} in for k.
y=\cfrac{2}{7} \, x
How to determine the constant of variation from a graph
In order to determine the constant of variation from the graph:
- Select two coordinates on the graph (use gridlines).
- Determine the change in the \textbf{y} values.
- Determine the change in the \textbf{x} values.
- Calculate the constant of the variation \bf{\textbf{k} = \cfrac{\textbf{y}}{\textbf{x}}}.
Example 3: determine the constant of variation from a graph
Find the constant of variation from the graph.
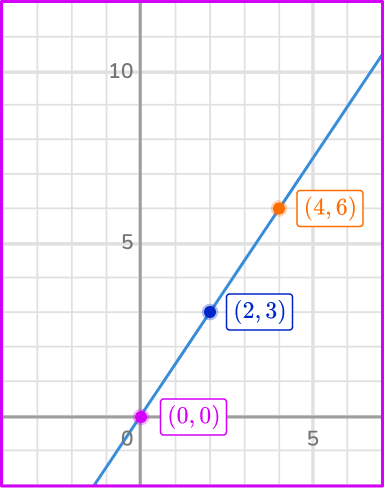
As the origin (0, \, 0) is a point on the line, use the origin and another point (2, \, 3).
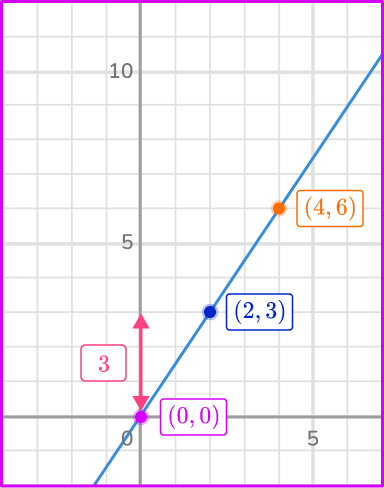
From the origin (0, \, 0) to the point on the line (2, \, 3) the change in the vertical, y direction is 3 units up. This means y=3.
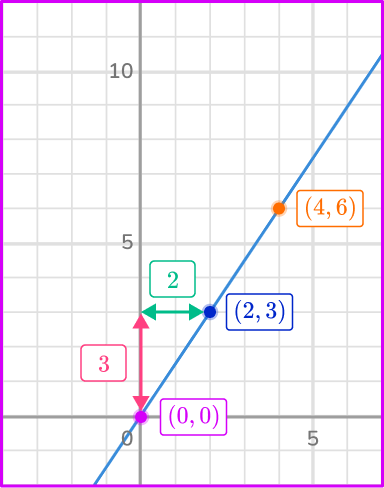
From the origin (0, \, 0) to the point on the line (2, \, 3) the change in the horizontal, x direction is 2 units right. This means x=2.
The constant of variation k=\cfrac{y}{x} with y=3 and x=2\text{:}
k=\cfrac{y}{x}=\cfrac{3}{2}
Notice how each of the points have the same ratio: (2, \, 3) and (4, \, 6).
\cfrac{y}{x}=\cfrac{3}{2}=\cfrac{6}{4} \rightarrow Equal ratios is another way of showing that they are proportional.
Note: The horizontal and vertical components can be calculated from any two coordinates on the straight line as the rate of change is the same.
Example 4: determine the constant of variation from a graph
Find the constant of variation from the graph.
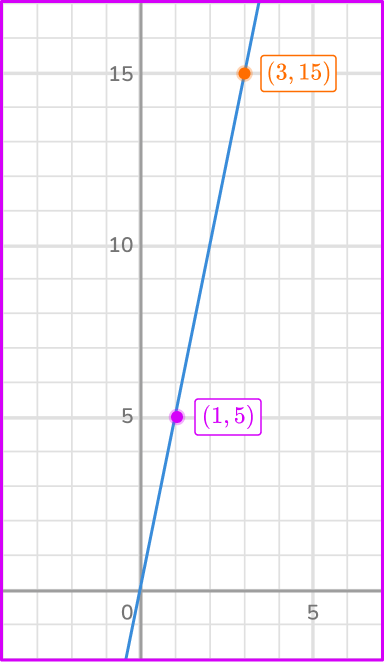
Note, in this example, we will not use the origin.
Choose the two coordinates on the line (1,\, 5) and (3, \, 15).
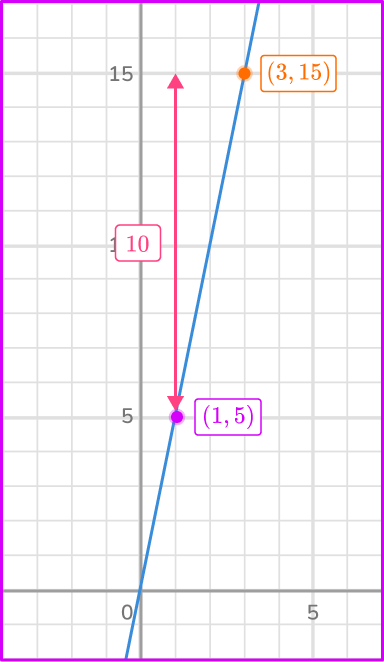
From (1, \, 5) to the other point on the line (3, \, 15) the change in the vertical, y direction is 10 units up. This means y=10.
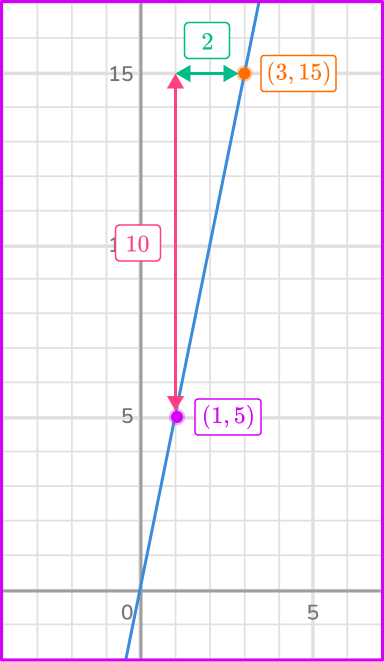
From (1, \, 5) to the other point on the line (3, \, 15) the change in the horizontal, x direction is 2 units right. This means x=2.
The constant of variation k=\cfrac{y}{x} with y=10 and x=2\text{:}
k=\cfrac{y}{x}=\cfrac{10}{2}=5
Notice how each of the points have the same ratio: (1, \, 5) and (3, \, 15).
\cfrac{y}{x}=\cfrac{5}{1}=\cfrac{15}{3}
How to determine the unit rate from a graph
In order to determine the unit rate from a graph:
- Write the point(s) as ratios \left(\cfrac{\textbf{y}}{\textbf{x}}\right).
- Write and explain the unit rate.
Example 5: unit rate
The graph of the direct variation between the number of cupcakes and the cost (in dollars) is shown below. Find the unit rate.
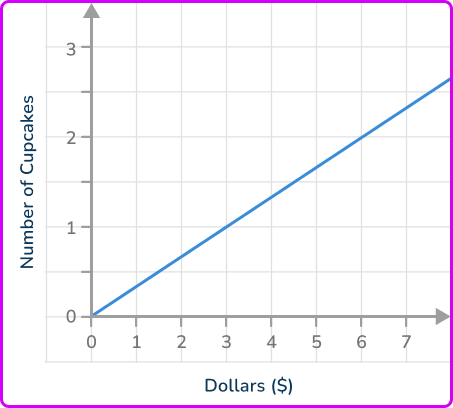
Two points on the line that intersect gridlines are (3, \, 1) and (6, \, 2).
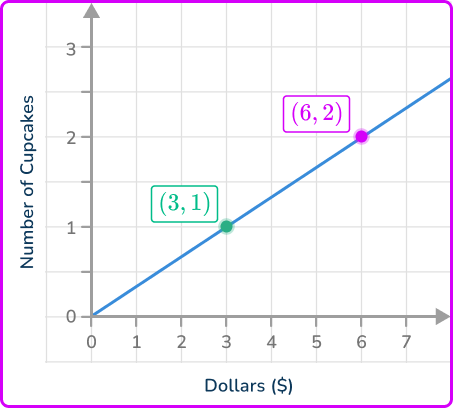
Important: As the difference between each point and the origin is the same as the x \, - and y \, - values in each coordinate, the change in y and the change in x are the same as the coordinate values.
For example, the coordinate (3, \, 1) is 1 unit vertically and 3 units horizontally from the origin so the change in y=1 and the change in x=3. This method does not work if y is not directly proportional to x.
(3, \, 1)~\rightarrow~\cfrac{y}{x}=\cfrac{3}{1}
(6, \, 2)~\rightarrow~\cfrac{y}{x}=\cfrac{6}{2}=\cfrac{3}{1}
The unit rate is the constant of proportionality (constant of variation) with a denominator of 1.
As the ratio of each coordinate is \cfrac{3}{1}, this represents the unit rate meaning that 3 cupcakes can be purchased for \$ 1.
The unit rate is also the slope of the line.
Note: Despite the origin lying on the line, it is impossible to determine the unit rate using the origin in this way due to the understanding outlined in step 1.
Example 6: unit rate
The graph below represents a proportional relationship between the number of pages in a book Jena reads per number of hours. Find the unit rate.
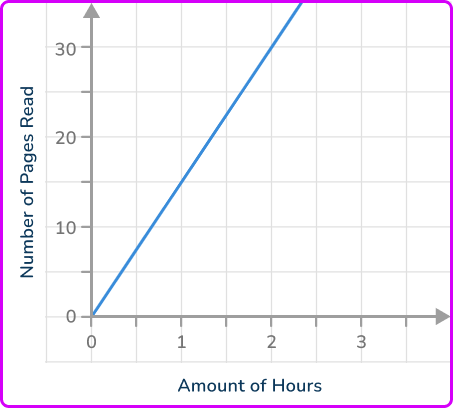
A coordinate on the line that intersects the gridlines is (2, \, 30).
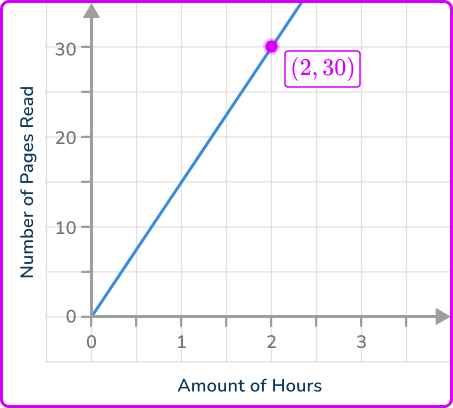
As the change in y and the change in x from the origin to the coordinate are the same as the respective coordinate values,
\cfrac{y}{x}=\cfrac{30}{2}=\cfrac{15}{1}.
The unit rate is the constant of proportionality (constant of variation) with a denominator of 1. Here, the unit rate is the number of pages read per hour.
As k=\cfrac{15}{1}, the unit rate is 15 pages read in 1 hour.
Teaching tips for direct variation equation
- Have students explore the relationship between the equation y=kx and constant of variation on a graph using investigative/exploratory activities.
- Help students to visualize the horizontal and vertical changes by drawing right triangles between two coordinates on the gridlines to show the change in y and the change in x. Show that different triangles through different coordinates are either congruent or similar and therefore have the same ratio of side lengths.
- Use real-life word problems to discuss the unit rate and the constant of proportion, such as the cost per number of items or the number of questions answered per unit of time.
Easy mistakes to make
- Confusing the constant of proportionality
For example, thinking that the constant of proportionality or the constant of variation is represented as \cfrac{x}{y} instead of \cfrac{y}{x}.
- Assuming the constant of proportionality can only be an integer
The constant of proportionality can be an integer (a whole number), but they can also be decimals or fractions. For example,
y=\cfrac{x}{2}=\cfrac{1}{2} \times x=0.5 \times x
Even though there is a fraction, the constant of proportionality is \cfrac{1}{2} or 0.5.
Practice direct variation equation questions
1. Which of these equations does NOT represent a direct variation?


Direct variation equations are in the form of y=kx.
The only equation that is not in that form is y=x+2.
Also, for direct proportion there can be no addition or subtraction involved in the equation.
2. If x and y vary directly, find the constant of variation when x=8 and y=2?
To find the constant of variation you can use the equation of direct variation, y=kx or k=\cfrac{y}{x}.
In either case, substitute into the equation the given values for x and y and solve for k.
k=\cfrac{2}{8}=\cfrac{1}{4}
3. If x and y vary directly and x=3 when y=12, what is the direct variation equation?
To find the equation of direct variation use the equation, y=kx and substitute in the values for x and y to first find k.
\begin{aligned}&12=3k \\\\ &4=k \end{aligned}
After calculating k, write the direct variation equation.
y=4x
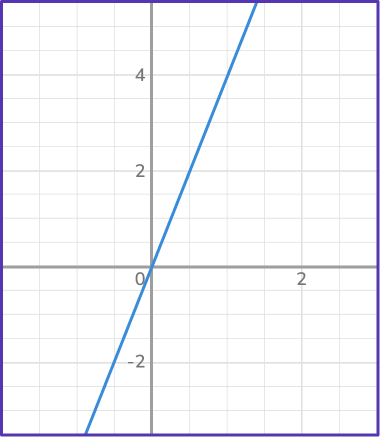
4. Which graph represents direct variation?
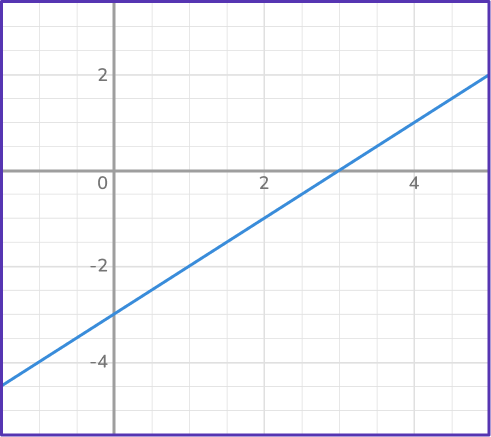
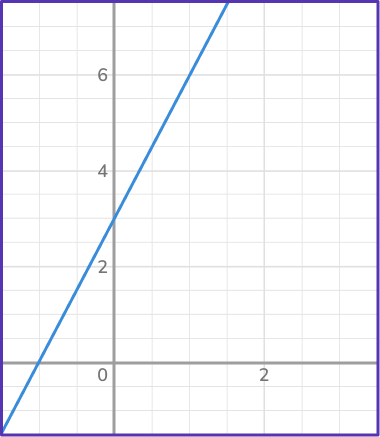

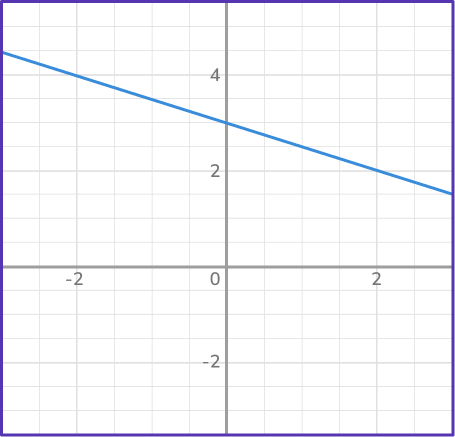
A direct variation graph is represented by a straight line that goes through the origin. Lines that go through the origin represent proportional relationships. In this case, there is only one line that intersects the origin:
5. Determine the constant of variation from the graph.
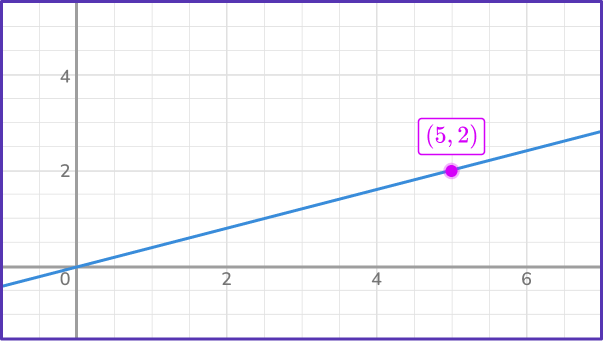
The constant of variation is the amount of units up and across from one point to the next. It is also the same as the constant of proportionality or slope of the line.
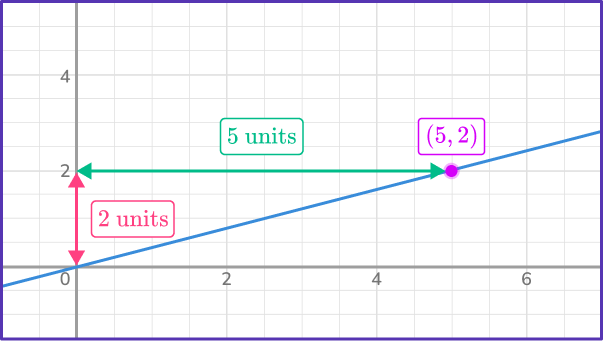
Here, k=\cfrac{y}{x}=\cfrac{2}{5}.
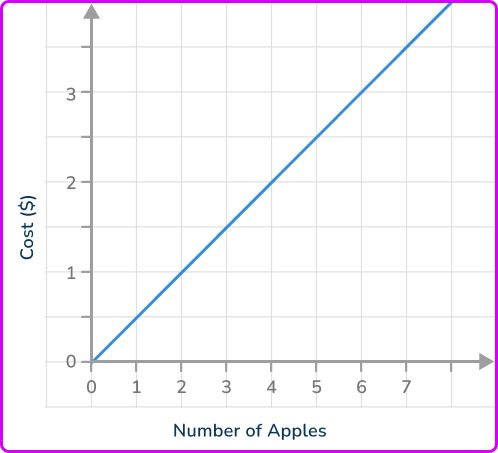
6. The graph represents the amount of apples purchased for a specific amount of dollars. Find the cost per apple.
\$ 4 per apple
\$ 3 per apples
\$ 2 per apple
\$ 1 per apple
From a point on the graph, the point (4, \, 2) represents 4 apples for \$ 2.
You can write this as a ratio, \cfrac{y}{x}=\cfrac{4}{2}.
This ratio can be simplified to be \cfrac{4}{2}=\cfrac{2}{1} which means 2 apples for \$ 1.
Direct variation equation FAQs
Technically in a direct variation equation, x ≠ 0, because the constant of variation is equal to \cfrac{y}{x} and you cannot have division by 0.
However, when graphing a direct variation the line will go through the origin (0, \, 0).
Yes, the constant of variation is the same as the constant of proportionality because it represents the constant ratio. It also is the same as the slope.
Yes, the linear equation of direct variation is y=kx which can be interpreted as y=mx or y=mx+b where the y -intercept is 0.
The constant of variation which is k is the same as the slope of a line which is m. So, in the equations, m is equal to k.
See also: Slope intercept form of a line
When y is inversely proportional to x, as x increases, the value of y decreases. This gives the equation y=\cfrac{k}{x}.
Rearranging this inverse variation equation to make k the subject means that k=xy or the constant of variation k is the product of the respective x and y values.
The next lessons are
- Converting fractions decimals and percents
- Percent
- Compound measures
Still stuck?
At Third Space Learning, we specialize in helping teachers and school leaders to provide personalized math support for more of their students through high-quality, online one-on-one math tutoring delivered by subject experts.
Each week, our tutors support thousands of students who are at risk of not meeting their grade-level expectations, and help accelerate their progress and boost their confidence.

Find out how we can help your students achieve success with our math tutoring programs.
[FREE] Common Core Practice Tests (3rd to 8th Grade)
Prepare for math tests in your state with these 3rd Grade to 8th Grade practice assessments for Common Core and state equivalents.
Get your 6 multiple choice practice tests with detailed answers to support test prep, created by US math teachers for US math teachers!