

PISA 2025 Scores: What The US Results Say About Students Who Are Furthest Behind

In the PISA 2025 results, published in September 2026, US 15-year-olds scored 463 in math, the same as the OECD average.
Of the 37 other OECD countries, 14 scored significantly higher than the US, 16 were not significantly different and 7 scored lower.
The math score wasn’t significantly different from 2022, so the headlines that week were about reading scores, which fell 14 points to 490, the lowest US average since PISA began in 2000.
As the founder of a tutoring company, I’m not a neutral reader of this data, but I think the most useful evidence for American schools is the country’s own national data, which every superintendent already has.
When we look underneath the average, we see that the students at the bottom in math have fallen further behind over two decades, while the students at the top have pulled ahead.

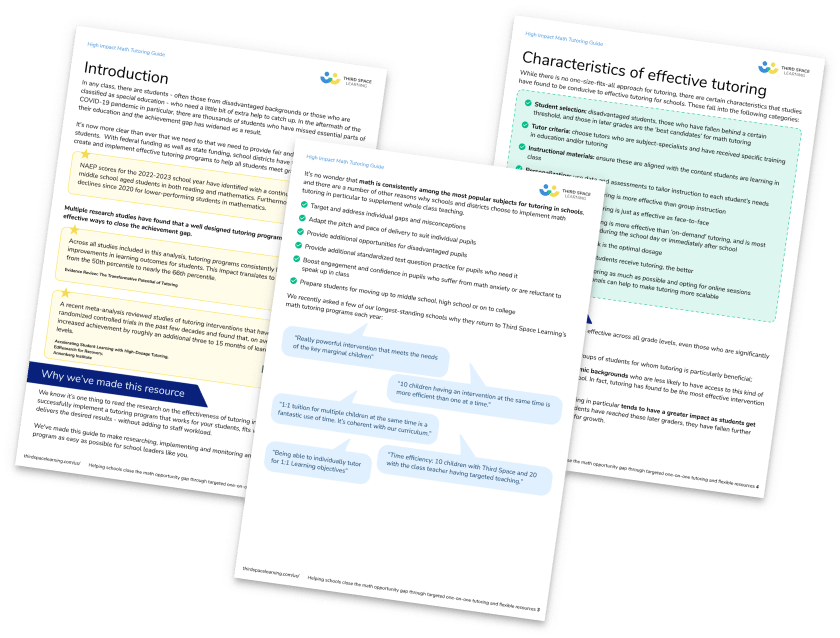
Effective Math Interventions - A Guide for Schools and Districts
Everything you need to know about how to implement effective tiered interventions, covering Tier 1, Tier 2, and Tier 3 for math. Detailed recommendations and examples of best practice in math interventions for each tier
Download Free Now!Key takeaways
- In the PISA scores for 2025, the US came in at 463 in math, the OECD average, but we have to look underneath the average to see where students are.
- On the Nation’s Report Card, the lowest-scoring 8th graders have fallen behind while the highest scorers have moved up.
- 55% of economically disadvantaged 8th graders were below NAEP Basic in math in 2024, up from 46% in 2019.
- Researchers who compare interventions put tutoring among the most effective ways to help students who are behind, and the federal government funded it through ESSER for that reason.
- With ESSER gone, districts need a way to keep what makes tutoring work at a cost they can afford.
What is PISA and how do PISA scores work?
PISA, the Program for International Student Assessment, is the international test the OECD uses to compare 15-year-olds in the US with students in other countries. It began in 2000, and the next round is PISA 2029.
Each round covers three subjects: reading, mathematics and science. The questions aren’t tied to any one curriculum. They ask students to use what they know on problems they might meet outside school, so a student can do better or worse on PISA than on a state test.
Students take the PISA test on a computer, and their answers are turned into scores on a scale where the average across OECD countries was set at about 500 when each subject was first the main focus. In math, that average was 463 in 2025.
There are also proficiency levels in PISA, from below Level 1 up to Level 6. Level 2 is the baseline, the point at which students begin to use math in simple real-life situations.
In the US, NCES runs PISA and reports how US students did compared with students in the other education systems that took part. Each country tests a sample of students, so there’s a margin of error on every score, and a gap of a few score points between two countries often isn’t a real difference. NCES only reports a difference when it’s statistically significant, which is why “not significantly different” comes up so often in this post.
Where do US PISA scores rank in 2025?
NCES describes the US math score of 463 as “not significantly different from the OECD average”.
- About a third of US students (35%) were below Level 2, the baseline for using math in everyday situations.
- 8% reached Level 5 or above.
| Country | Math score, PISA 2025 |
|---|---|
| Singapore | 563 |
| Japan | 525 |
| South Korea | 522 |
| Estonia | 508 |
| Switzerland | 499 |
| United Kingdom | 488 |
| Canada* | 485 |
| Poland | 484 |
| Ireland | 480 |
| Italy | 468 |
| Germany | 464 |
| United States | 463 |
| OECD average | 463 |
| France | 458 |
*Canada did not meet PISA sampling standards; the OECD says its national results are likely biased upward, by up to about 15 points in science.
For American schools, though, I think the Nation’s Report Card is better evidence than PISA scores:
- It’s written into federal law.
- States take part in it as a condition of their Title I funding.
- It reports statistical significance on its comparisons.
The PISA data are also weaker evidence this cycle, because the US didn’t meet the international sampling standards. The weighted school response rate was 54%, compared with an 85% target, and more than 40% of the students who responded were never given the student questionnaire.
Which US students are falling behind in math?
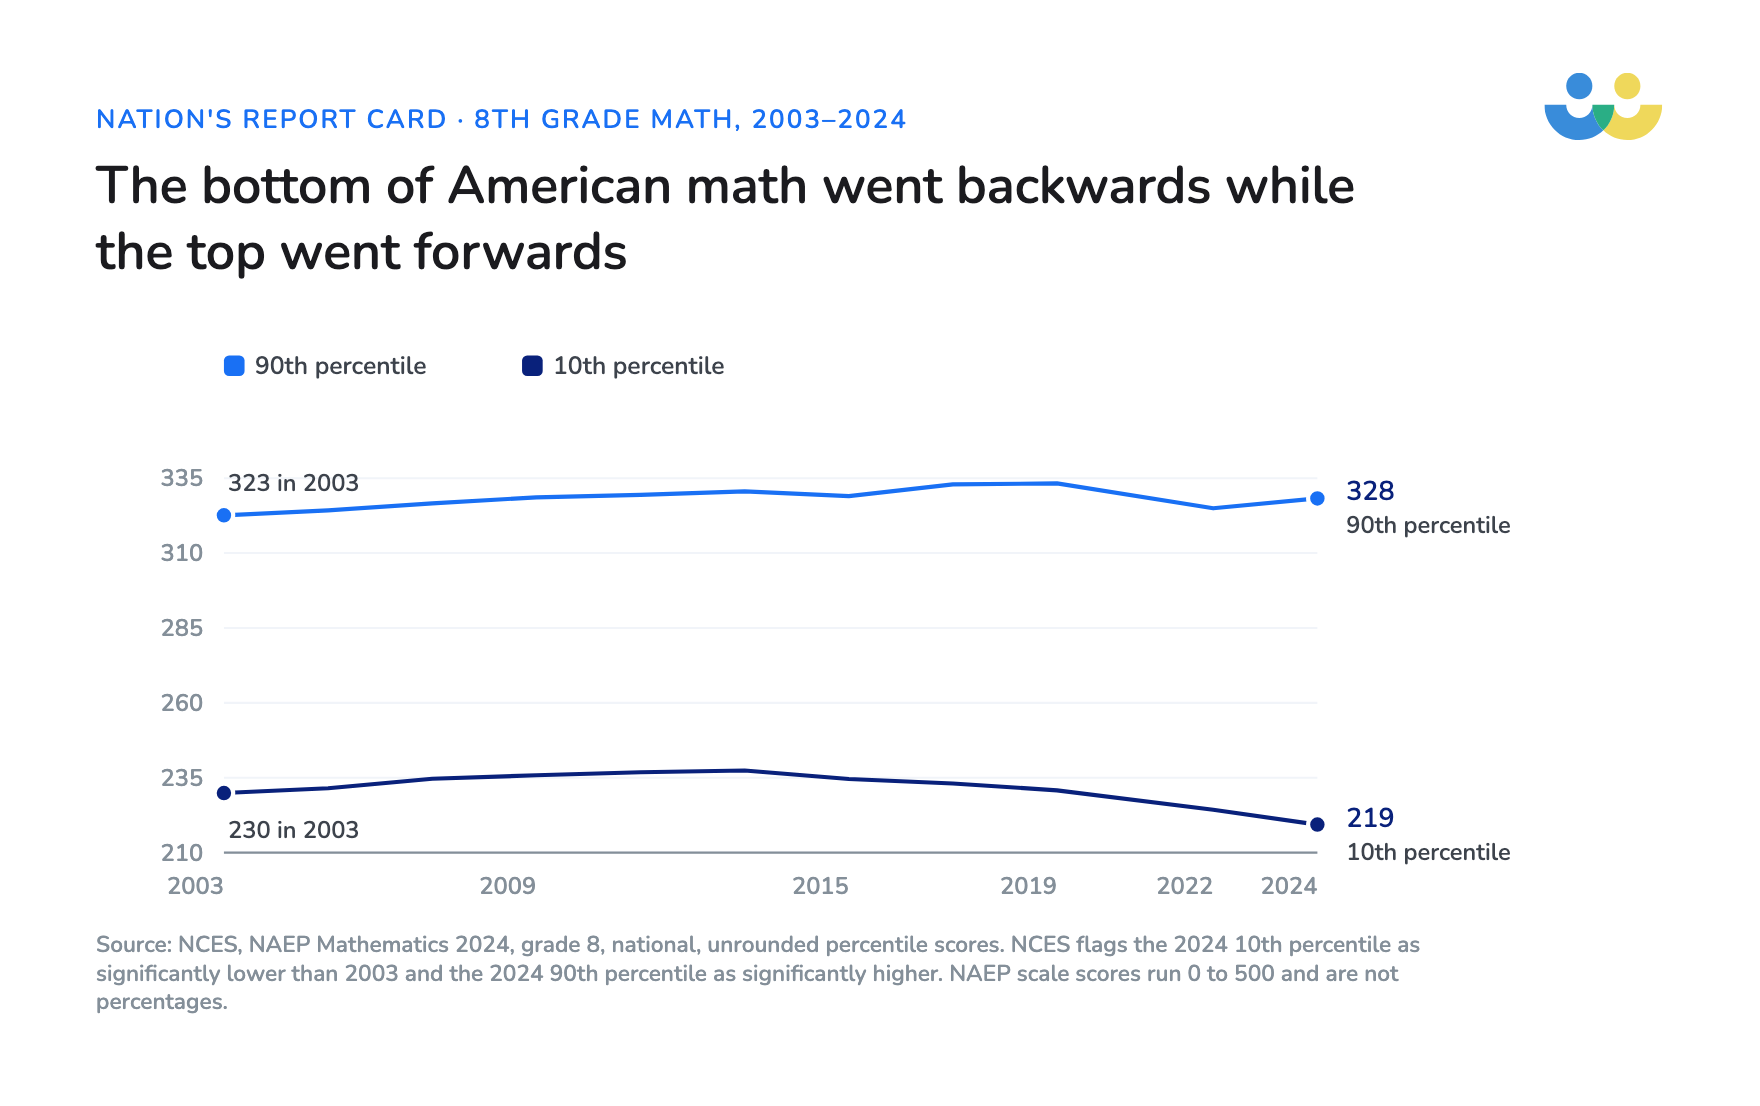
On NAEP’s 8th grade math test, students at the 10th percentile scored about 230 in 2003 and 219 in 2024, which NCES flags as significantly lower.
At the 90th percentile it went the other way: students scored about 323 in 2003 and 328 in 2024, which NCES flags as significantly higher.
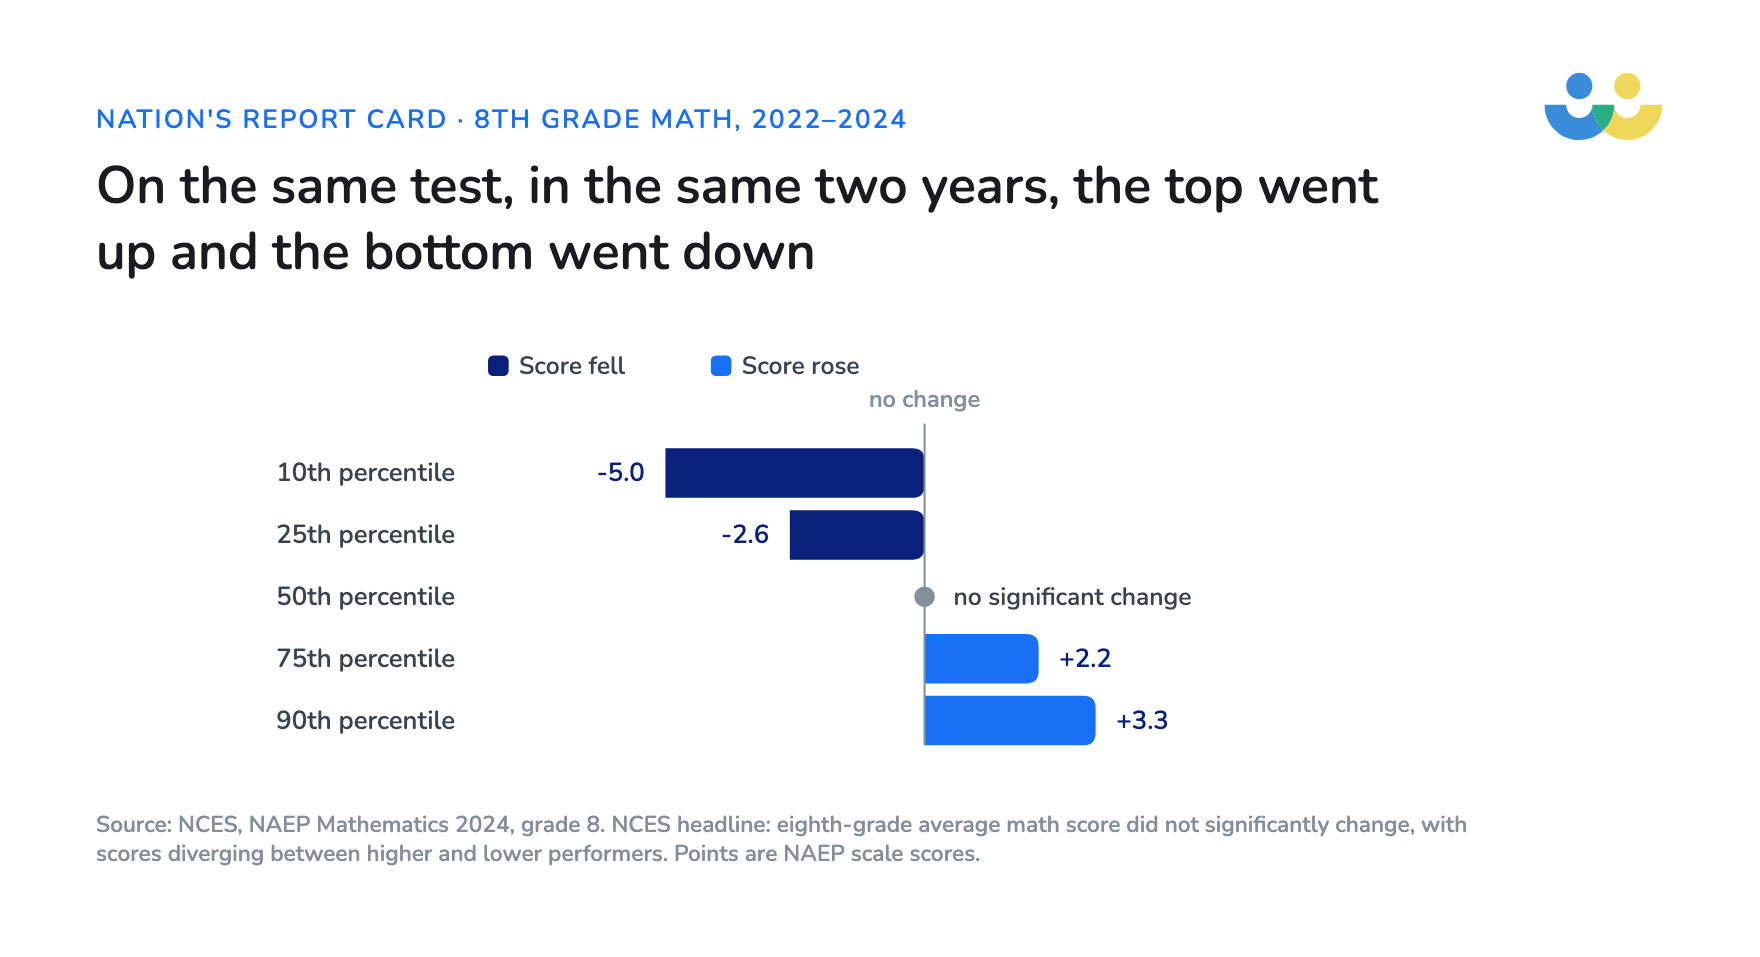
We see the same pattern over a shorter period. Between 2022 and 2024, on the same test, 8th graders:
- at the 10th percentile fell 5.0 points
- at the 25th percentile fell 2.6 points
- at the 75th percentile rose 2.2 points
- at the 90th percentile rose 3.3 points.
All four changes are statistically significant. The median didn’t change significantly, and nor did the average.
The National Assessment Governing Board put it plainly: “Gaps are growing between higher-performing and lower-performing students – a trend we’ve been seeing for more than a decade.”
The share of 8th graders below NAEP Basic went from 31% in 2019 to 39% in 2024.
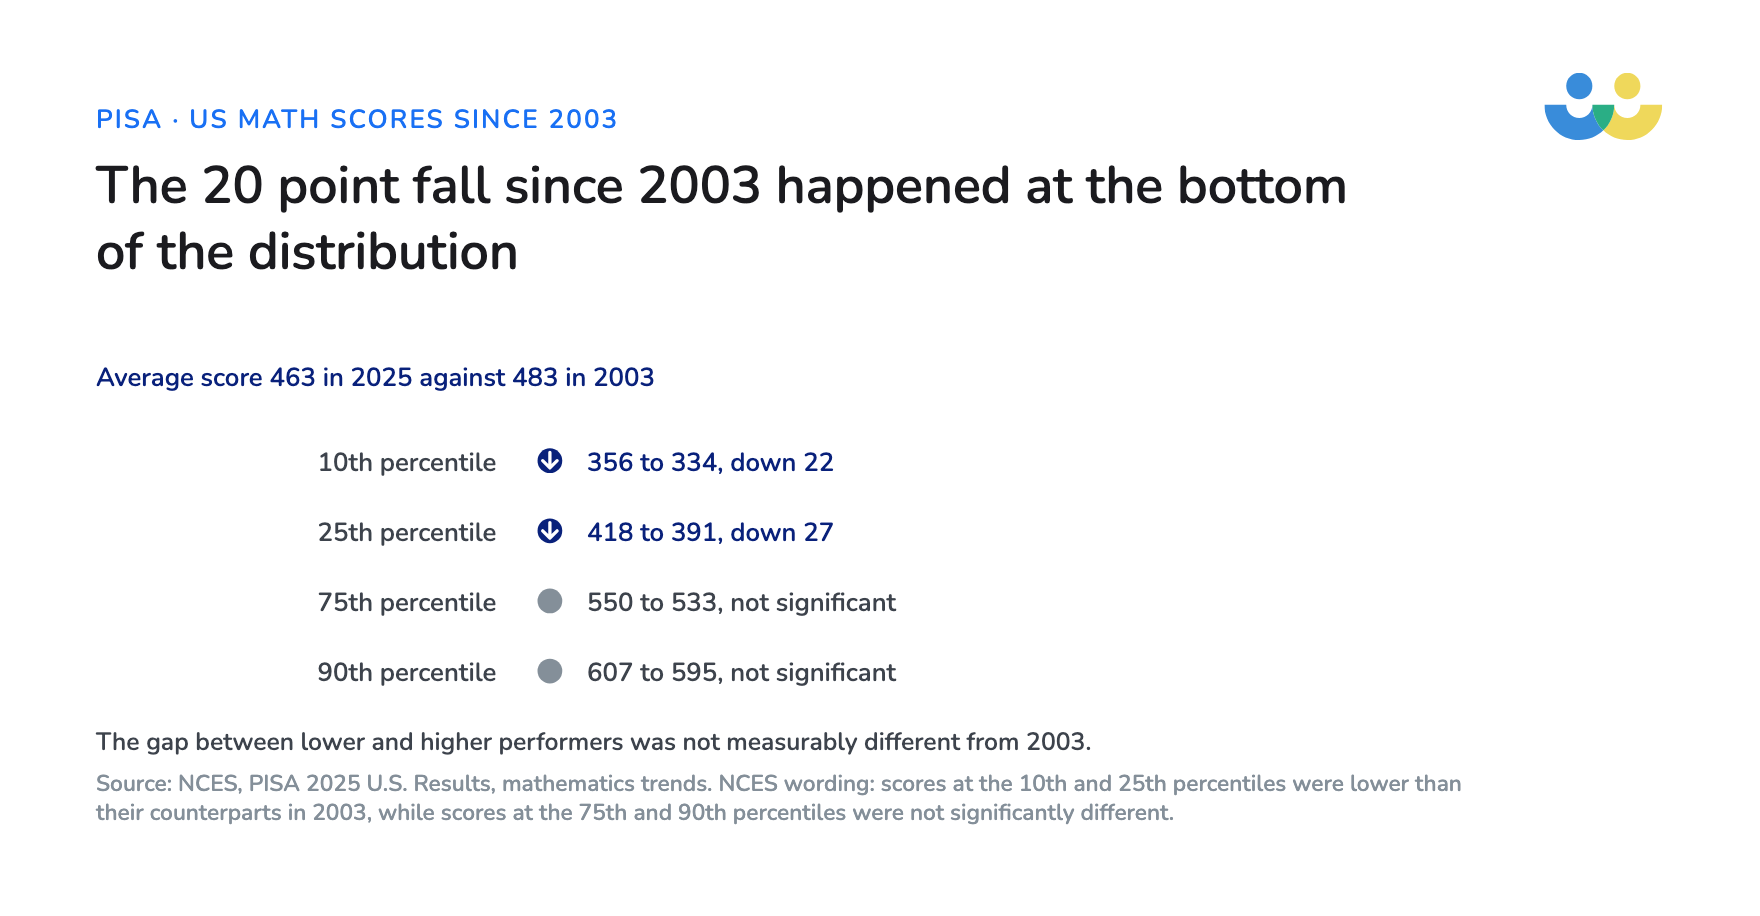
We see the same story in the PISA scores, on a weaker sample. The US scored 483 in math in 2003 and 463 in 2025, and NCES says the students who lost ground were the ones already furthest behind: “scores at the 10th and 25th percentiles were lower than their counterparts in 2003, while scores at the 75th and 90th percentiles were not significantly different from those in 2003.”
| Percentile | 2003 | 2025 | Change |
|---|---|---|---|
| 10th | 356 | 334 | -22, significant |
| 25th | 418 | 391 | -27, significant |
| 75th | 550 | 533 | not significant |
| 90th | 607 | 595 | not significant |
NCES also says the distance between lower and higher performers wasn’t measurably different in 2025 from 2003, so I won’t claim the PISA gap widened.
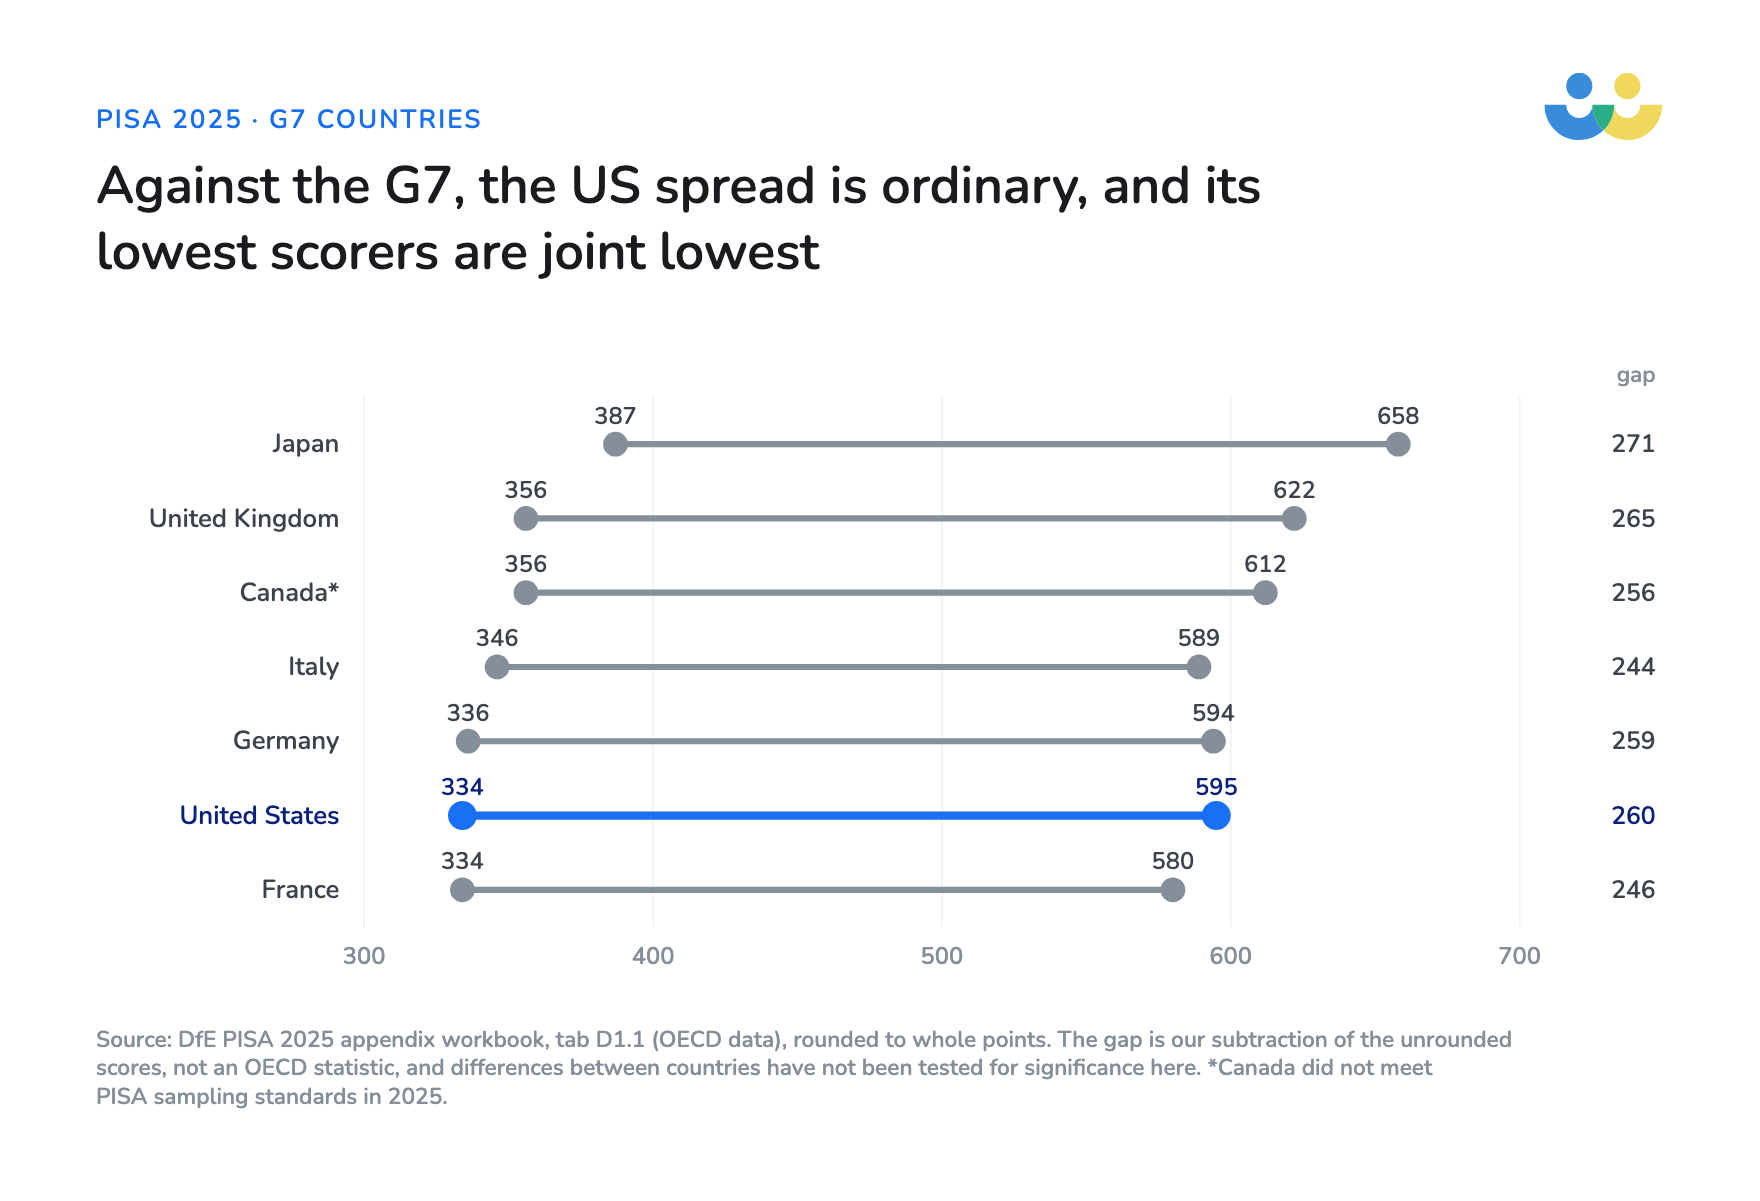
If you compare US PISA scores with those of the other countries Americans usually look to, the gap between the top and bottom students in the US is about the same as in those countries. US students at the 10th percentile scored 334 and those at the 90th scored 595, a gap of about 260 points.
- Canada’s* gap is 256.
- Germany’s is 259.
- The UK’s is 265.
- Japan’s is 271.
The US’s low performers are a different matter: students at the 10th percentile scored the same as France’s, the lowest in the G7, while at the 90th percentile US students were in the middle of the G7.
Who are the students furthest behind?
Economically disadvantaged students are more likely than their peers to be below NAEP Basic.
In 2024, 55% of economically disadvantaged 8th graders were below NAEP Basic in math, compared with 26% of their peers. In 2019 the figures were 46% and 18%.
(NCES changed the label for this group from National School Lunch Program eligibility to “economically disadvantaged” in 2024; the figures go back to 2003.)
The average score for economically disadvantaged 8th graders fell 8.8 points compared with 2019, and NCES reported declines for students with disabilities and English learners too.
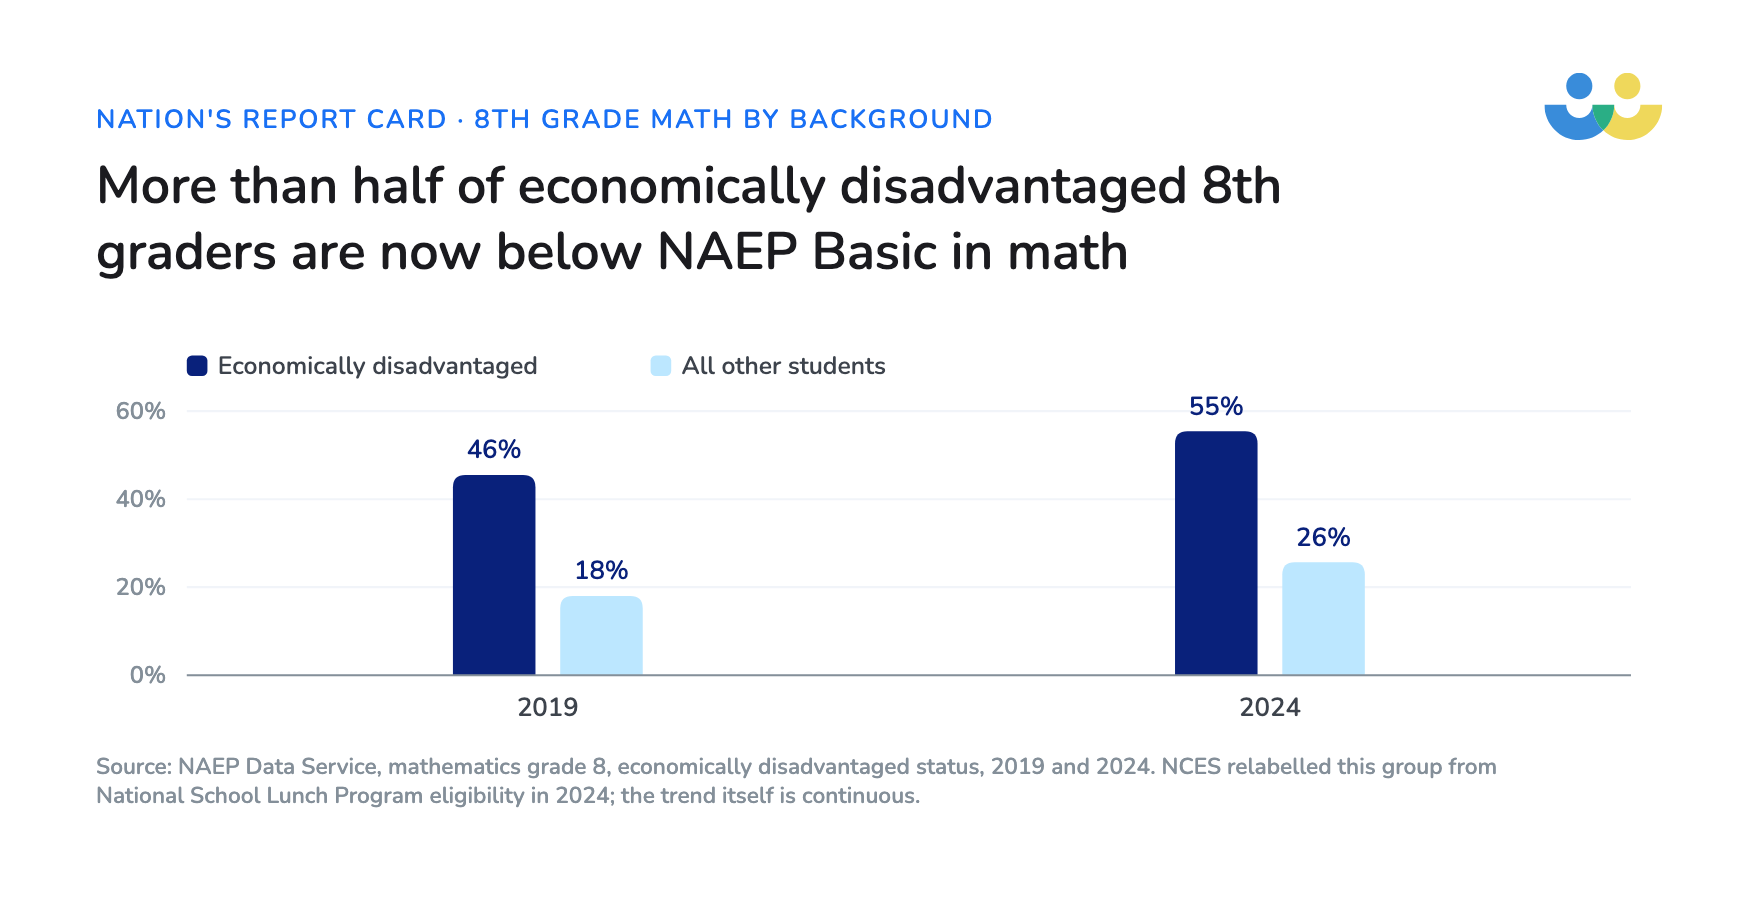
More students are below NAEP Basic than in 2019, even though the gap between disadvantaged students and their peers isn’t significantly wider on NAEP’s own measure.
NAEP also reports results by race and ethnicity. In 2024, 62% of Black 8th graders and 54% of Hispanic 8th graders were below NAEP Basic in math, up from 53% and 43% in 2019. For White 8th graders the figure was 26%, up from 20%.
We see the same pattern by family background in PISA, though the OECD says that its US background data are incomplete. More than 40% of students weren’t given the questionnaire that these figures are based on, and nine states were left out, so treat them as indicative.
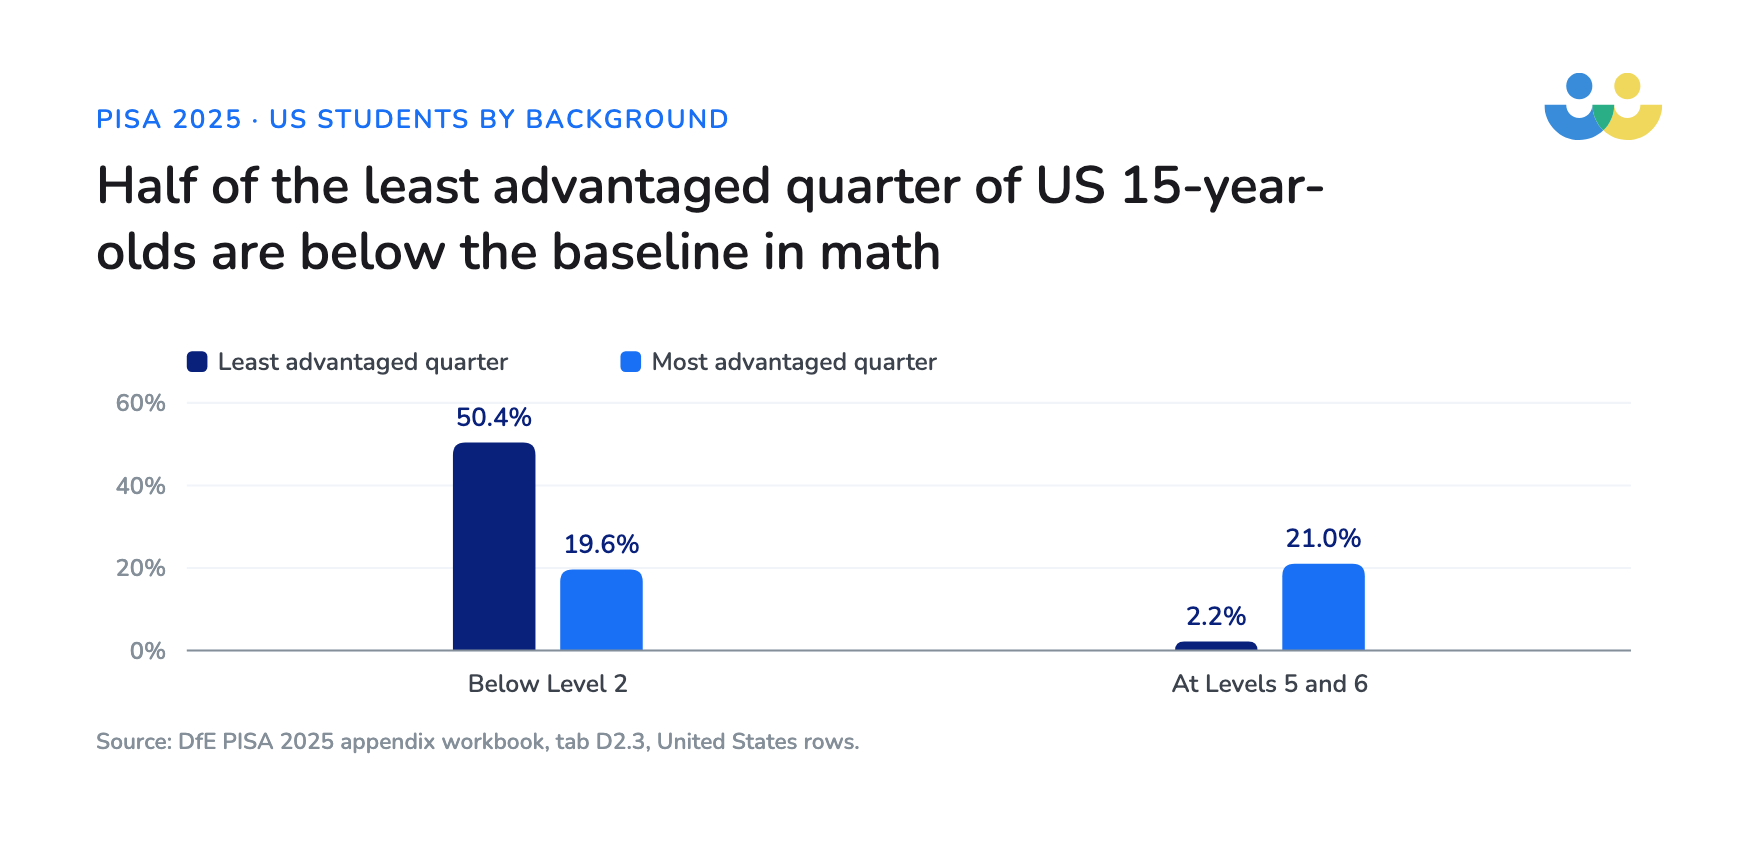
- In the least advantaged quarter of US students, 50.4% were below Level 2 in math, compared with 19.6% in the most advantaged quarter.
- At the top, 2.2% of the least advantaged quarter reached Level 5 or above, compared with 21.0% of the most advantaged.
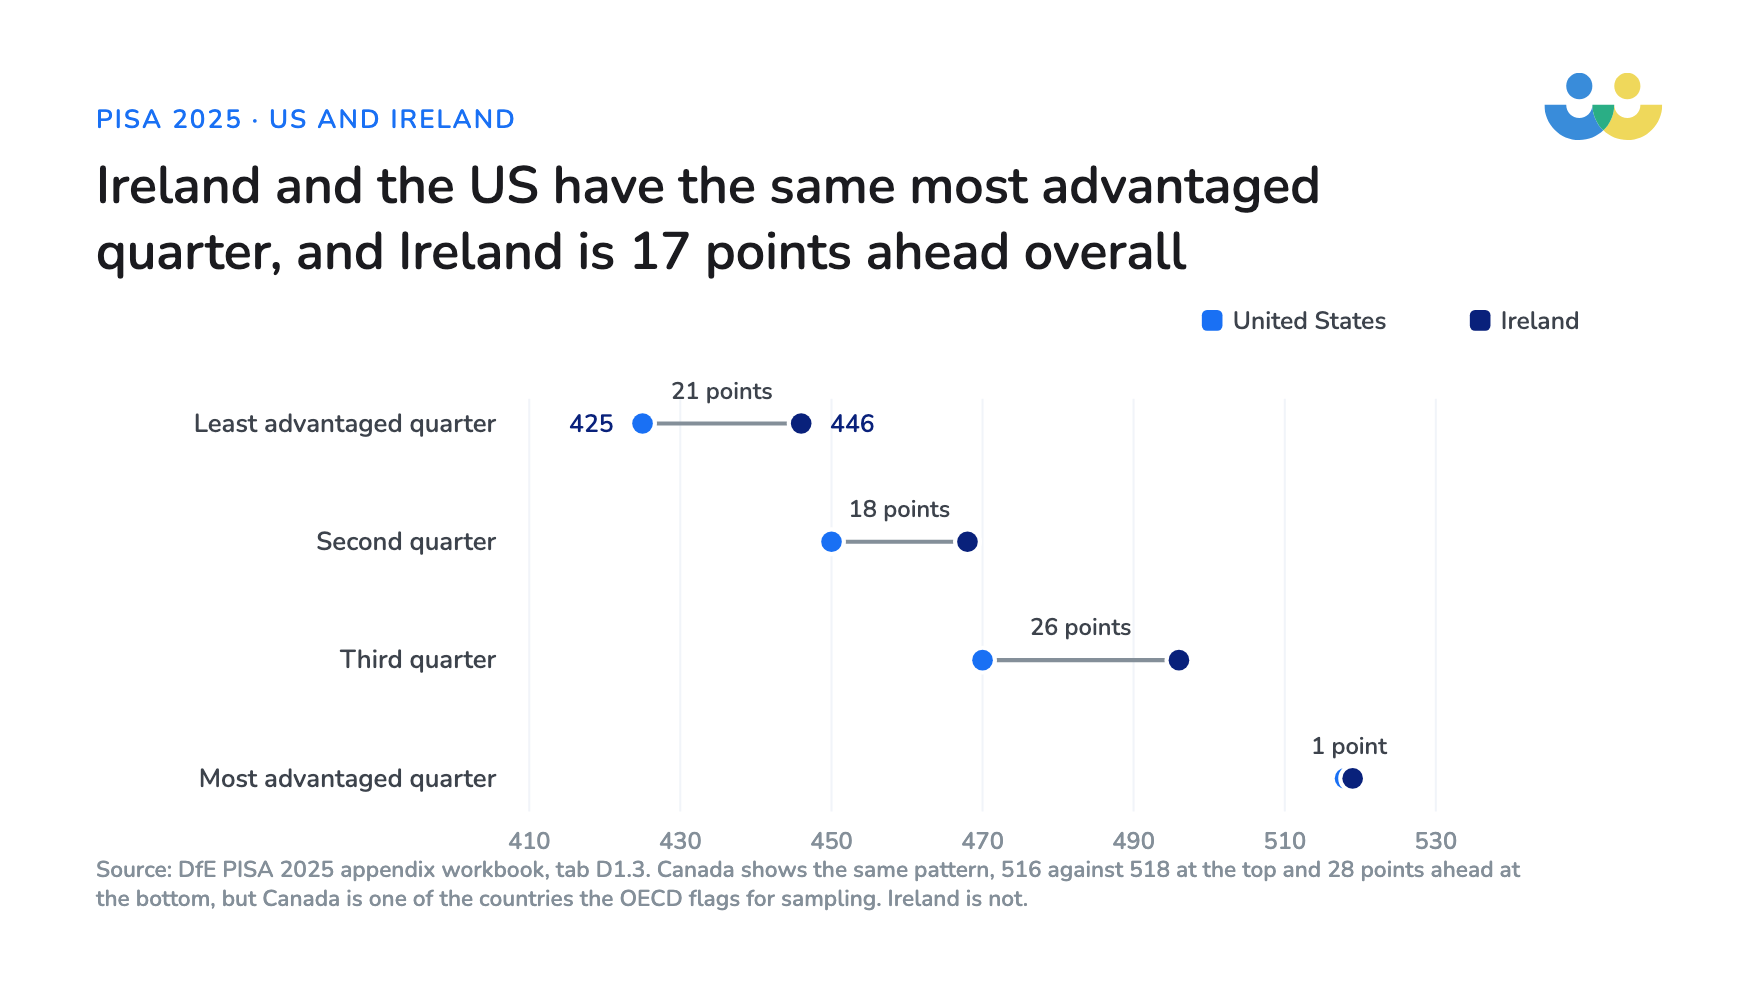
Ireland is the comparison I find most useful.
- Ireland’s most advantaged quarter scored 519 and the US’s 518, one point apart.
- Ireland’s least advantaged quarter scored 446 and the US’s 425.
Ireland’s average is 17 points higher than the US’s, and almost all of that difference is in its students below the top quarter.
I think that when districts focused recovery on the whole class, they reached the students who were closest to grade level and didn’t reach the students furthest from it.
So we know where the problem is and which students have fallen furthest behind, and any district will want to know what works for students who are this far behind.
What is the most effective way to help students who are behind in math?
When researchers compare school interventions side by side, they consistently find tutoring among the most effective for students who are behind, in math as well as reading.
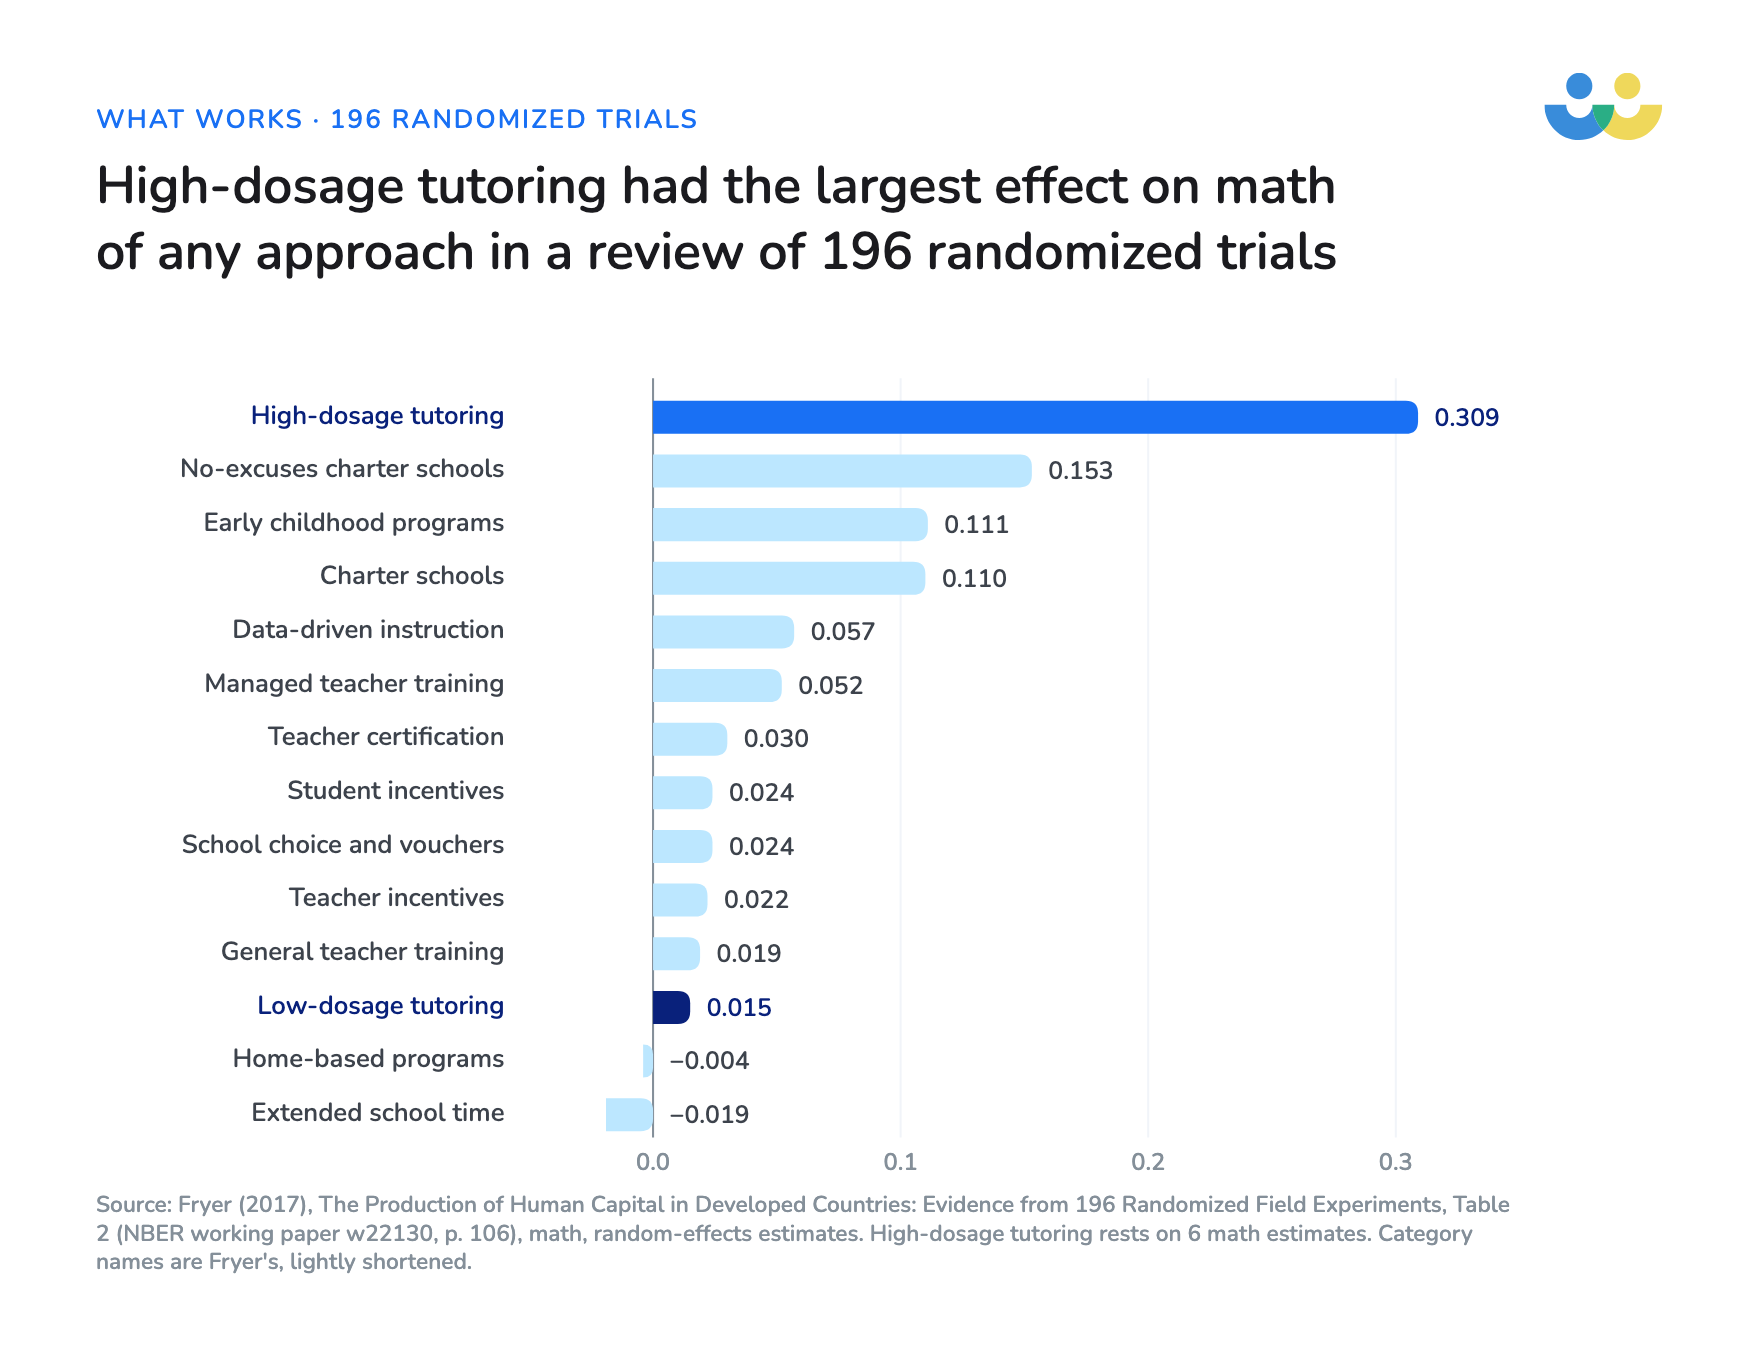
The broadest comparison I know is Roland Fryer’s 2017 review of 196 randomized field experiments. In math, high-dosage tutoring had the largest average effect of any of the categories Fryer used, at 0.309 standard deviations, about double the next school-based approach. It’s based on six math estimates, so I’d treat it as a strong signal rather than a precise number.
I think every district should notice another detail in the same review: low-dosage tutoring, given less often than three days a week or in bigger groups, averaged 0.015 standard deviations in math, close to nothing. That’s based on only three estimates, though. From Fryer’s split, it looks as though how often students are tutored, and in how small a group, make a large difference.
Other researchers have found the same:
- In elementary math, Pellegrini, Lake, Neitzel and Slavin (2021) found tutoring had the highest average effect of six types of program, narrowly ahead of teacher training in classroom management, and concluded that “low achievers can make substantial gains in mathematics if they receive relatively cost-effective small group tutoring”.
- Across 89 studies, Nickow, Oreopoulos and Quan (2024) found an average effect of 0.288 standard deviations, and 0.268 in math.
- In a 2024 research brief, Carly Robinson, Matthew Kraft, Susanna Loeb and Beth Schueler, from Stanford, Brown and the University of Virginia, go further: “High-impact tutoring is the most effective school-based intervention for students struggling in math and reading”.
Effects are smaller when programs get big. Matthew Kraft and colleagues estimate 0.16 to 0.21 standard deviations for programs serving hundreds or thousands of students, which they still call “very impressive for large-scale education interventions”.
The National Student Support Accelerator sets out what the effective programs have in common in its definition of high-impact tutoring: three or more sessions a week for at least ten weeks, one-on-one or in groups of no more than four, during the school day, with a consistent, well-trained tutor, linked to what students are learning in class.
Where does tutoring fit in an MTSS framework?
Districts already have a framework to put tutoring in. MTSS is written into federal law in the Every Student Succeeds Act. In a study published in 2020, Berkeley and colleagues reviewed the websites of all 50 state education agencies and found “a major trend in adoption” of multi-tiered systems of support.
Tutoring has a natural place in MTSS. Stanford’s National Student Support Accelerator says it can sit at any of the three tiers, and Tier 2 is where many districts put it.
The Center on Multi-Tiered System of Supports at the American Institutes for Research describes Tier 2 as small-group, standardized intervention provided in addition to Tier 1, typically for 3 to 7 students at a time. The Institute of Education Sciences describes typical Tier 2 math intervention as 20 to 40 minutes, four to five times a week, using the same math language students meet in core instruction.
Districts had the evidence and a framework to put tutoring in, and after COVID they had the money too. But for tutoring to work, you have to get the implementation right.
The experience of ESSER-funded tutoring support post-COVID
The federal government knew the research:
- Congress appropriated $189.5 billion for schools through ESSER.
- The American Rescue Plan required districts to set aside at least 20% of their ESSER III share for lost instructional time.
- The Department of Education named “intensive or high-dosage tutoring” as its first example of an evidence-based intervention.
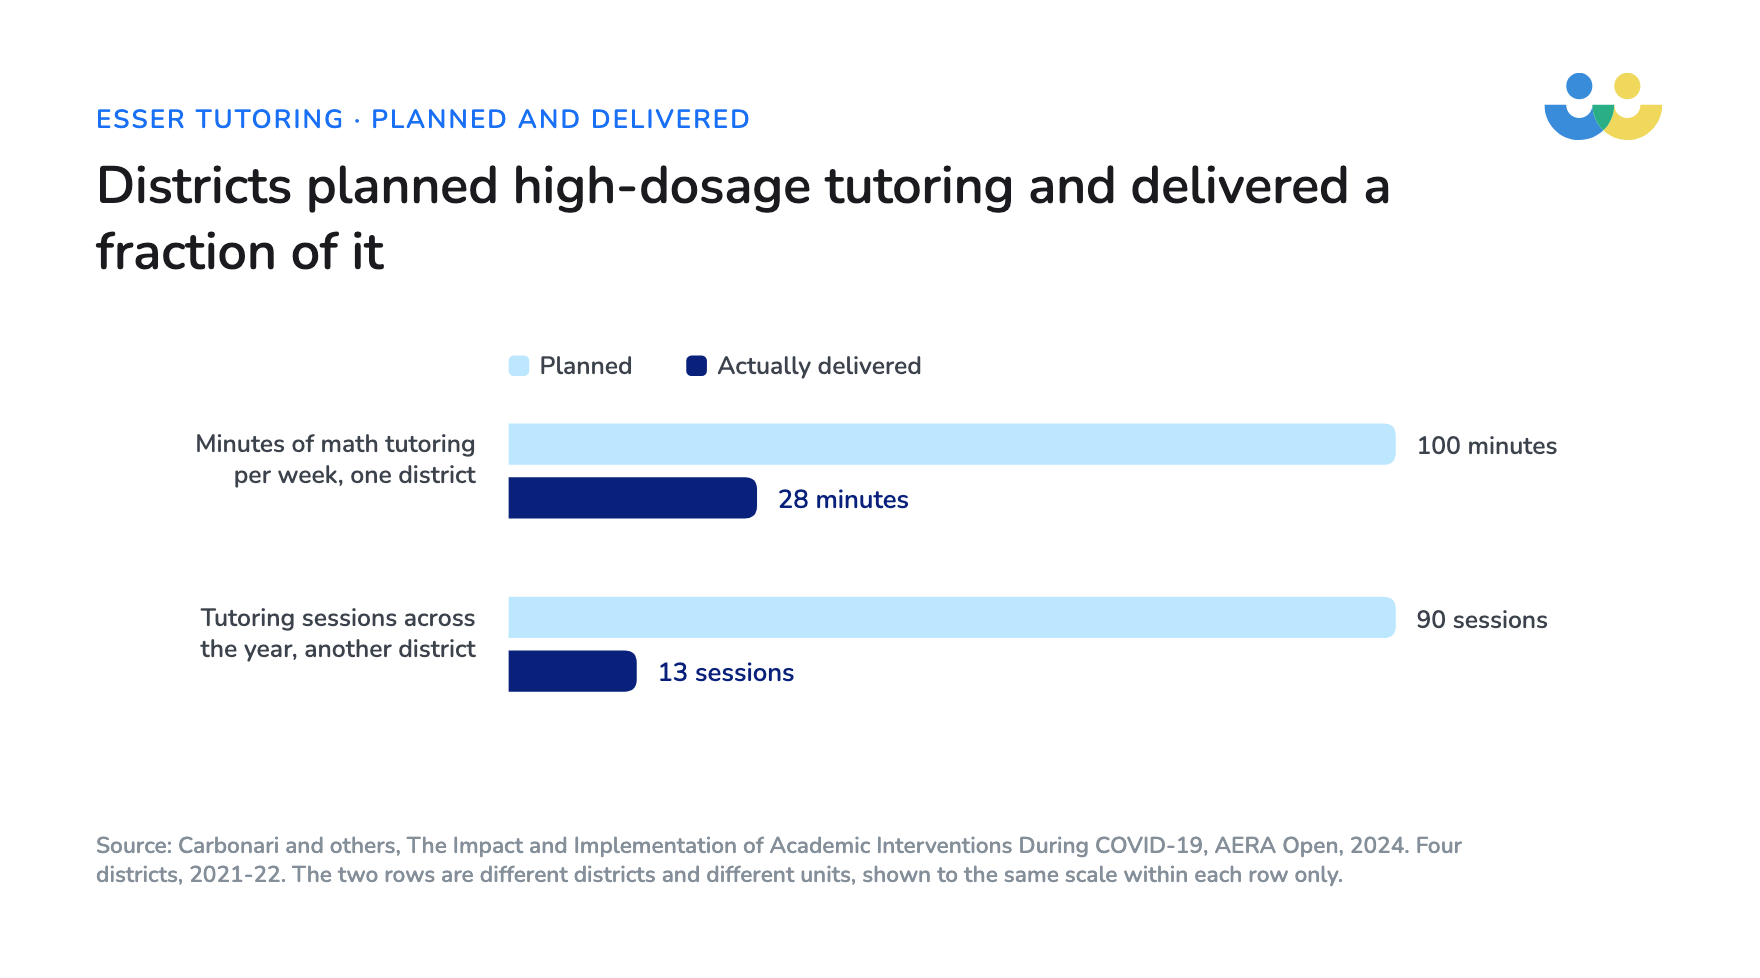
However, districts struggled to get the tutoring to students. In the Road to Recovery study of four districts:
- one planned 100 minutes of math tutoring a week and the average student got 28
- another planned 90 sessions over the year and students attended 13.
In a follow-up study of programs in eight districts in 2022–23, serving more than 12,000 students, the same team found that tutoring and small-group instruction had an average effect on math of 0.03 standard deviations, which wasn’t statistically significant. It looks a lot like Fryer’s low-dosage finding in practice: across these programs, fewer students took part, and for less time, than districts had planned.
High-dosage tutoring that meets a quality standard costs districts anywhere from $1,000 to over $3,000 a student, according to the budgeting guide from Stanford’s National Student Support Accelerator. In fall 2022, the USC Schaeffer Center found in a survey that under 2% of students were getting tutoring that met even a moderate quality bar.
What happened to tutoring when ESSER funding ended?
ESSER funding has now run out. When the EdWeek Research Center asked district and school leaders what they had already cut because the funds ended, tutoring came second at 30%, just behind professional development at 31%.
Districts now have to run Tier 2 with whoever is left to deliver it. The Institute of Education Sciences says that person “may be the general classroom teacher, a mathematics coach, a special education instructor”. RAND finds teachers already working 49 hours a week, 10 more than they’re contracted for.
As I see it, districts in 2021 knew what effective tutoring looked like and had federal money to pay for it. In 2026 they still know what it looks like, but without that money they have to find another way to deliver it.
How can districts keep what works about tutoring without ESSER?
Whatever districts choose has to keep the things that made tutoring work in the research:
- one-on-one or very small groups
- three or more sessions a week, scheduled into the school day
- lessons linked to what students are learning in class
- an adult making sure it happens (in the research, that adult was the tutor).
And it has to be something a district can afford without federal recovery money, for every student who needs it rather than the few the district could pay for before.
Of the options districts are weighing, AI tutoring could bring the cost down the most, but only if it keeps everything on that list.
How close is AI tutoring to human tutoring?
The answer depends on how schools use it, and Stanford’s researchers have shown what happens when students are left to use it on their own.
In August 2026 the SCALE Initiative and the National Student Support Accelerator at Stanford rated AI tutoring by how much human support comes with it. They concluded that “high-impact tutoring remains defined by live human-led instruction”. They rated:
- AI tutoring where a student works without direct human oversight as “emergent evidence; unknown effectiveness”
- AI tutoring with human support as “emergent evidence; early research indicates implementation determines effectiveness on student outcomes”.
In March 2026, SCALE said in a review of more than 800 papers: “we did not identify any high-quality causal studies in K-12 settings in the U.S. for students”. No study of Skye meets that bar yet either.
Stanford’s researchers name engagement as the first problem: students given an AI tutor often don’t use it. When students were left to work independently on an AI reading platform, “40% to 47% of students never used the AI platform at all”, and those who did averaged “two to five minutes per week”. In a study of 99 districts by Khan Academy’s own researchers, described in Education Next, only 4.7% of students used Khan Academy as recommended.
It’s the same problem the ESSER tutoring programs had: students got only a fraction of the tutoring that was planned. I’d test any AI tutor on two things: how closely it reproduces the tutoring that worked in the research, and whether students actually get enough of it.
We built Skye to meet that test. Skye is a spoken AI math tutor for grades 3 to 8 that leads each student through a program of lessons one-on-one, in sessions the school schedules during the school day and, in most schools, a staff member supervises. The teacher chooses who takes part and which program they follow, so the lessons can match what the class is learning in Tier 1.
Every lesson starts with a diagnostic check, is designed by experienced teachers and math experts, and gives the student hints rather than the answer. It’s built on insights from 2,295,000 one-on-one tutoring sessions across 4,200 schools since 2013.
We built it for the student who won’t raise their hand, is nervous to try and finds it hard to explain their thinking.
“Especially the students who are more introverted or shy, those kids find learning with Skye especially engaging. It allows them to be more vulnerable.”
Ryan Lucas, Principal, Governor’s Ranch Elementary School, Colorado
In Stanford’s terms, Skye is “AI tutoring with human support”, where the results depend on how well a school implements it. We haven’t met the evidence bar for AI tutoring yet.
What does Skye cost, and what evidence are we building?
A District License is $150 per student per year, against the $1,000 to over $3,000 a student that high-impact tutoring typically costs, so a district can reach far more of the students who need it. In its Dear Colleague letter of July 22, 2025, the Department of Education confirmed that federal grant funds may be used for “intelligent tutoring systems“, where the spending meets each program’s requirements.
Schools are already tracking students’ progress with Skye on their own assessments. At Governor’s Ranch Elementary in Colorado, Principal Ryan Lucas started the program with 25 students who, in his words, “fell between the 40th and 60th percentile in terms of achievement”, so they weren’t the students furthest behind. From the school’s own data, he reported:
“75% of students who had low growth and low achievement in December moved into high growth and high achievement, vs 18% of students in the same group who didn’t receive the AI tutoring.”
Ryan Lucas, Principal, Governor’s Ranch Elementary School, Colorado
At Primary Hall Charter School in Buffalo, New York, Director of Curriculum and Instruction Madeline Loeb rolled Skye out to every 3rd to 5th grader and is tracking growth on MAP too.
In February 2026 we announced a two-year research partnership with Stanford and Cornell, funded by the Gates Foundation. There’s no published result from it yet, and when there is, the researchers will publish it themselves.
In the meantime, I think every district should ask any tutoring provider, AI or human, how much tutoring each student actually gets:
- the sessions scheduled and attended
- the minutes each student gets per week
- broken down by student group.
Few providers publish those figures, even though this is where the ESSER programs fell short, and we think every provider should, including us.
Do you have students who need extra support in math?
Skye – our AI math tutor built by experienced teachers – provides students with personalized one-on-one, spoken instruction that helps them master concepts, close skill gaps, and gain confidence.
Since 2013, we’ve delivered 2,295,000 math tutoring sessions to 196,000 students, guiding them toward higher math achievement.
Discover how our AI math tutoring can boost student success, or see how our math programs can support your school’s goals:
– 3rd grade tutoring
– 4th grade tutoring
– 5th grade tutoring
– 6th grade tutoring
– 7th grade tutoring
– 8th grade tutoring
FAQs
In PISA 2025, US 15-year-olds scored 463 in math, the same as the OECD average.
Yes. The OECD published the latest PISA results, for 2025, in September 2026. The next round is PISA 2029.
Among whole countries, Singapore scored highest in math in PISA 2025, at 563. Of all the education systems that took part, Beijing, Shanghai, Jiangsu and Zhejiang, tested together as B-S-J-Z (China), scored highest, at 612.
Most countries scored lower in 2025 than in 2003: of 36 education systems tested in both years, 26 scored lower and 3 scored higher. We can’t use PISA to say why, because a different group of 15-year-olds takes the test each round.
The Nation’s Report Card is the National Assessment of Educational Progress (NAEP), the federal assessment of what US students know in math, reading and other subjects. States take part in the 4th and 8th grade reading and math assessments every two years as a condition of their Title I funding.
Key sources
- NCES: PISA 2025 U.S. results (September 2026)
- OECD: PISA 2025 Results (Volume I) (September 2026)
- The Nation’s Report Card: NAEP mathematics 2024, grades 4 and 8 (January 2025)
- National Assessment Governing Board: 10 takeaways from the 2024 NAEP results (2025)
- Fryer: The Production of Human Capital in Developed Countries (2017)
- Pellegrini, Lake, Neitzel and Slavin: Effective Programs in Elementary Mathematics (2021)
- Nickow, Oreopoulos and Quan: The Promise of Tutoring for PreK–12 Learning (2024)
- Carbonari and colleagues: The Road to Recovery (2024)
- Stanford NSSA: Developing a budget for high-impact tutoring
- Stanford SCALE Initiative: The evidence base on AI in K-12 (March 2026)
- Education Next: The 5 percent problem
- US Department of Education: Dear Colleague letter on AI (July 22, 2025)