

What Is Progress Monitoring? A Guide for Math Teachers, With Examples

Progress monitoring is a way of regularly checking whether a student is responding to the instruction or intervention they’re getting. You give a short, consistent assessment every week or two and graph the scores. The trend tells you whether to keep going, change the intervention or raise the goal.
If you teach math intervention groups, you’re probably already collecting some of this data. It’s easy to end up with a folder of quick checks and no clear decision about what to do next week, especially when you’re tracking a dozen students across two or three groups.
This guide explains what progress monitoring is and how it fits into a multi-tiered system of supports (MTSS) and Response to Intervention (RTI), including how often to monitor at each tier. It then shows you how to set a goal and read a graph using simple decision rules, before looking at the math progress monitoring tools schools use most and working through examples from grades 2 to 6. It assumes you know your students well, and gives you a routine that makes that knowledge easier to act on.
What is progress monitoring?
Progress monitoring is a type of formative assessment used to track student progress through instruction or an intervention. Each check is brief, typically between two and ten minutes depending on the grade level and the measure, and assesses the same skill in the same way, so this week’s score can be compared fairly with last week’s.
Unlike summative assessments, which tell you what a student learned by the end of a unit, progress monitoring tells you whether student learning is happening while there’s still time to do something about it. That’s why it’s a key component of MTSS and RTI.
You can use progress monitoring data to:
- See whether individual students are making enough progress toward a goal
- Decide which students and concepts need reteaching
- Judge whether an intervention is working, or whether it needs adjusting
- Identify students who aren’t responding to intervention and may need a special education evaluation
Schools also track student behavior with separate measures, often as part of a PBIS framework. This guide sticks to academic progress in math.

Progress monitoring vs other assessments
Most schools run several kinds of assessment through the year, and each one answers a different question. Progress monitoring is easiest to understand alongside the others.
| Assessment | The question it answers | Who takes it | How often |
|---|---|---|---|
| Universal screening | Which students are at risk and need additional support? | Every student | Two or three times a year (fall, winter, spring) |
| Diagnostic assessment | Which specific skills or misconceptions are getting in the way? | Students flagged by screening or by you | As needed, before planning an intervention |
| Progress monitoring | Is this student responding to the instruction or intervention? | Students in Tier 2 or Tier 3 | At least monthly at Tier 2, at least weekly at Tier 3 |
| Formative assessment | Did today’s lesson work? | The whole class | Every lesson (exit tickets, mini whiteboards, questioning) |
| Summative assessment | What did students learn by the end of the unit or year? | Every student | End of unit, end of year, state standardized tests |
The main difference between progress monitoring and formative assessment is consistency. A formative check changes with every lesson, while a progress monitoring probe stays the same so that the scores line up on one graph.
How is progress monitoring different in math and reading?
Progress monitoring is used in both reading and math, and NCII’s tools chart covers both, but the measures look quite different. In reading, most probes time a single skill, such as oral reading fluency, and DIBELS 8 is built around one-minute measures of this kind.
Math has two main types of probe. The IRIS Center at Vanderbilt University describes them as:
- Computation probes, which measure procedural knowledge, such as a mixed page of multi-digit addition and subtraction problems
- Concepts and applications probes, which assess conceptual understanding and a student’s ability to apply it, such as place value, fractions, measurement and word problems
For kindergarten and first grade, early numeracy probes cover skills such as oral counting, identifying numbers and picking the larger number in a pair.

3rd to 6th Grade Math test
Prepare for your state math test and track student progress with these 3rd-6th grade practice assessment for Common Core
Download Free Now!Is progress monitoring used for grading?
Progress monitoring data is not normally used for grading. Probes often sample skills from across the whole year, so scores start low in the fall and rise as students learn more, and grading them would mark students down for content you haven’t taught yet.
If one student’s scores stay flat while the rest of the group’s rise, they may be struggling with learning mathematics and need a math intervention.
Progress monitoring in MTSS and RTI
In the Response to Intervention and MTSS frameworks, progress monitoring is how intervention teams decide whether a student stays in a tier, moves up or moves down.

Tier 1
In Tier 1, every student takes a screening assessment two or three times a year. Screening supports early identification, because it shows you which students are at risk and might benefit from additional support before they fall far behind.
Tier 2
The support students receive in Tier 2 intervention is usually a targeted intervention in a small group a few times a week, such as math fact fluency. You monitor their progress throughout. If a student’s scores show they’ve caught up with their grade level, they can exit Tier 2. If their rate of improvement stays low, the team may move them to Tier 3.
Tier 3
Tier 3 interventions are the most intensive intervention, often one-on-one and planned around the individual student. Because the support is more individual, you monitor more often and use the data to make frequent adjustments to what you teach and how.
How often should you monitor progress?
The right frequency depends on the tier, and on how quickly you need to make a decision.
Frequency by tier
The National Center on Intensive Intervention (NCII) recommends monitoring progress at least monthly for students in Tier 2 and at least weekly for students in Tier 3. The What Works Clearinghouse’s practice guide on RTI for math makes a similar recommendation: monitor students in Tiers 2 and 3, and borderline Tier 1 students, at least once a month.
Intervention teams can go further and monitor Tier 2 students every week or two. Regular monitoring gives you more data points, so you reach a reliable decision sooner.
For Tier 1, screening in the fall, winter and spring is enough, and most students won’t need anything more.
How many data points you need
A single score tells you very little, because students have good days and bad days. Before you set a goal, collect a baseline of three to five data points over about a week. Then let the data build up before you change anything: NCII’s decision rules start after at least three weeks of instruction and six data points.
How to build a progress monitoring plan
A progress monitoring plan sets out what you’ll measure, how often, who will do it, what resources they’ll need and what you’ll do with the results. If you write it down before you implement the intervention, it’s far more likely to happen every week.
Step 1: Choose the skill and the measure
Start with the skill the intervention targets, then select progress monitoring tools that measure it at the student’s instructional level. Look for a measure with several equivalent forms, so you can give a new probe each week, and with evidence of technical adequacy (reliability and validity).
Step 2: Collect a baseline
Give the probe three times over a week and use the median score as the starting point.
Step 3: Set a goal
Use one of the methods in the next section to set an ambitious goal for the end of the intervention period.
Step 4: Schedule data collection
Put the probes in the calendar. Giving them on the same day each week, at the start of an intervention session, keeps the conditions the same.
Step 5: Graph and review
Plot every score on a graph as soon as you have it. A visual representation shows data patterns you’d miss in a spreadsheet, and it makes data-driven decision making much quicker in team meetings.
Setting goals and using decision rules
Data collection is only useful if it leads to instructional decisions, and decision rules give you a consistent way to read the graph and determine what to do next, so the decision doesn’t depend on who happens to be in the meeting.
Set the goal
NCII describes three ways to set an academic goal:
- With end-of-year benchmarks, the goal is the score your tool says a student should reach by the end of the year.
- National norms for rate of improvement give you a formula: multiply the typical weekly rate of improvement (ROI) by the number of weeks, then add the baseline. Goal = ROI × weeks + baseline.
- The intra-individual framework uses the student’s own rate of growth instead. Goal = their slope × 1.5 × weeks + baseline. This needs six to nine data points first, so it suits students who are already being monitored.
Draw the aimline
The aimline (or goal line) runs from the baseline score to the goal on your graph. It shows where a student’s scores should be each week if they’re on track to meet the goal.
Apply a decision rule
NCII’s decision rules give you two main options.
The first is the four-point rule. Once you have at least six data points from three weeks of instruction, look at the four most recent points:
- If all four are above the aimline, increase the goal.
- If all four are below the aimline, consider adapting the intervention.
- If they’re mixed, keep collecting data.
The second is trend-line analysis, which needs at least eight data points from four weeks. Compare the slope of the student’s trend line with the aimline. If the trend line is steeper, raise the goal. If it’s flatter, consider adapting the intervention and check that it’s being delivered as planned.
Worked example: a grade 3 computation probe
The numbers below are for illustration only, so use the norms from the tool you’re working with.
Maya is in third grade and has started a Tier 2 intervention on multi-digit addition and subtraction. Her three baseline computation probes score 8, 10 and 9 digits correct, so her baseline is 9. Say her tool’s norms suggest a rate of improvement of 1 digit correct per week, and the intervention runs for 10 weeks. Her goal is 1 × 10 + 9 = 19, and her aimline rises by 1 point a week.
| Week | Aimline | Maya’s score |
|---|---|---|
| 1 | 10 | 10 |
| 2 | 11 | 9 |
| 3 | 12 | 11 |
| 4 | 13 | 10 |
| 5 | 14 | 11 |
| 6 | 15 | 12 |
By week 6, Maya’s four most recent scores (weeks 3 to 6) are all below the aimline, so the four-point rule says to adapt the intervention. Her teacher looks at her probes and sees that most of her errors come from regrouping across zero, so the next four weeks focus on that skill with place value blocks before moving back to the written method.
| Week | Aimline | Maya’s score |
|---|---|---|
| 7 | 16 | 15 |
| 8 | 17 | 16 |
| 9 | 18 | 18 |
| 10 | 19 | 19 |
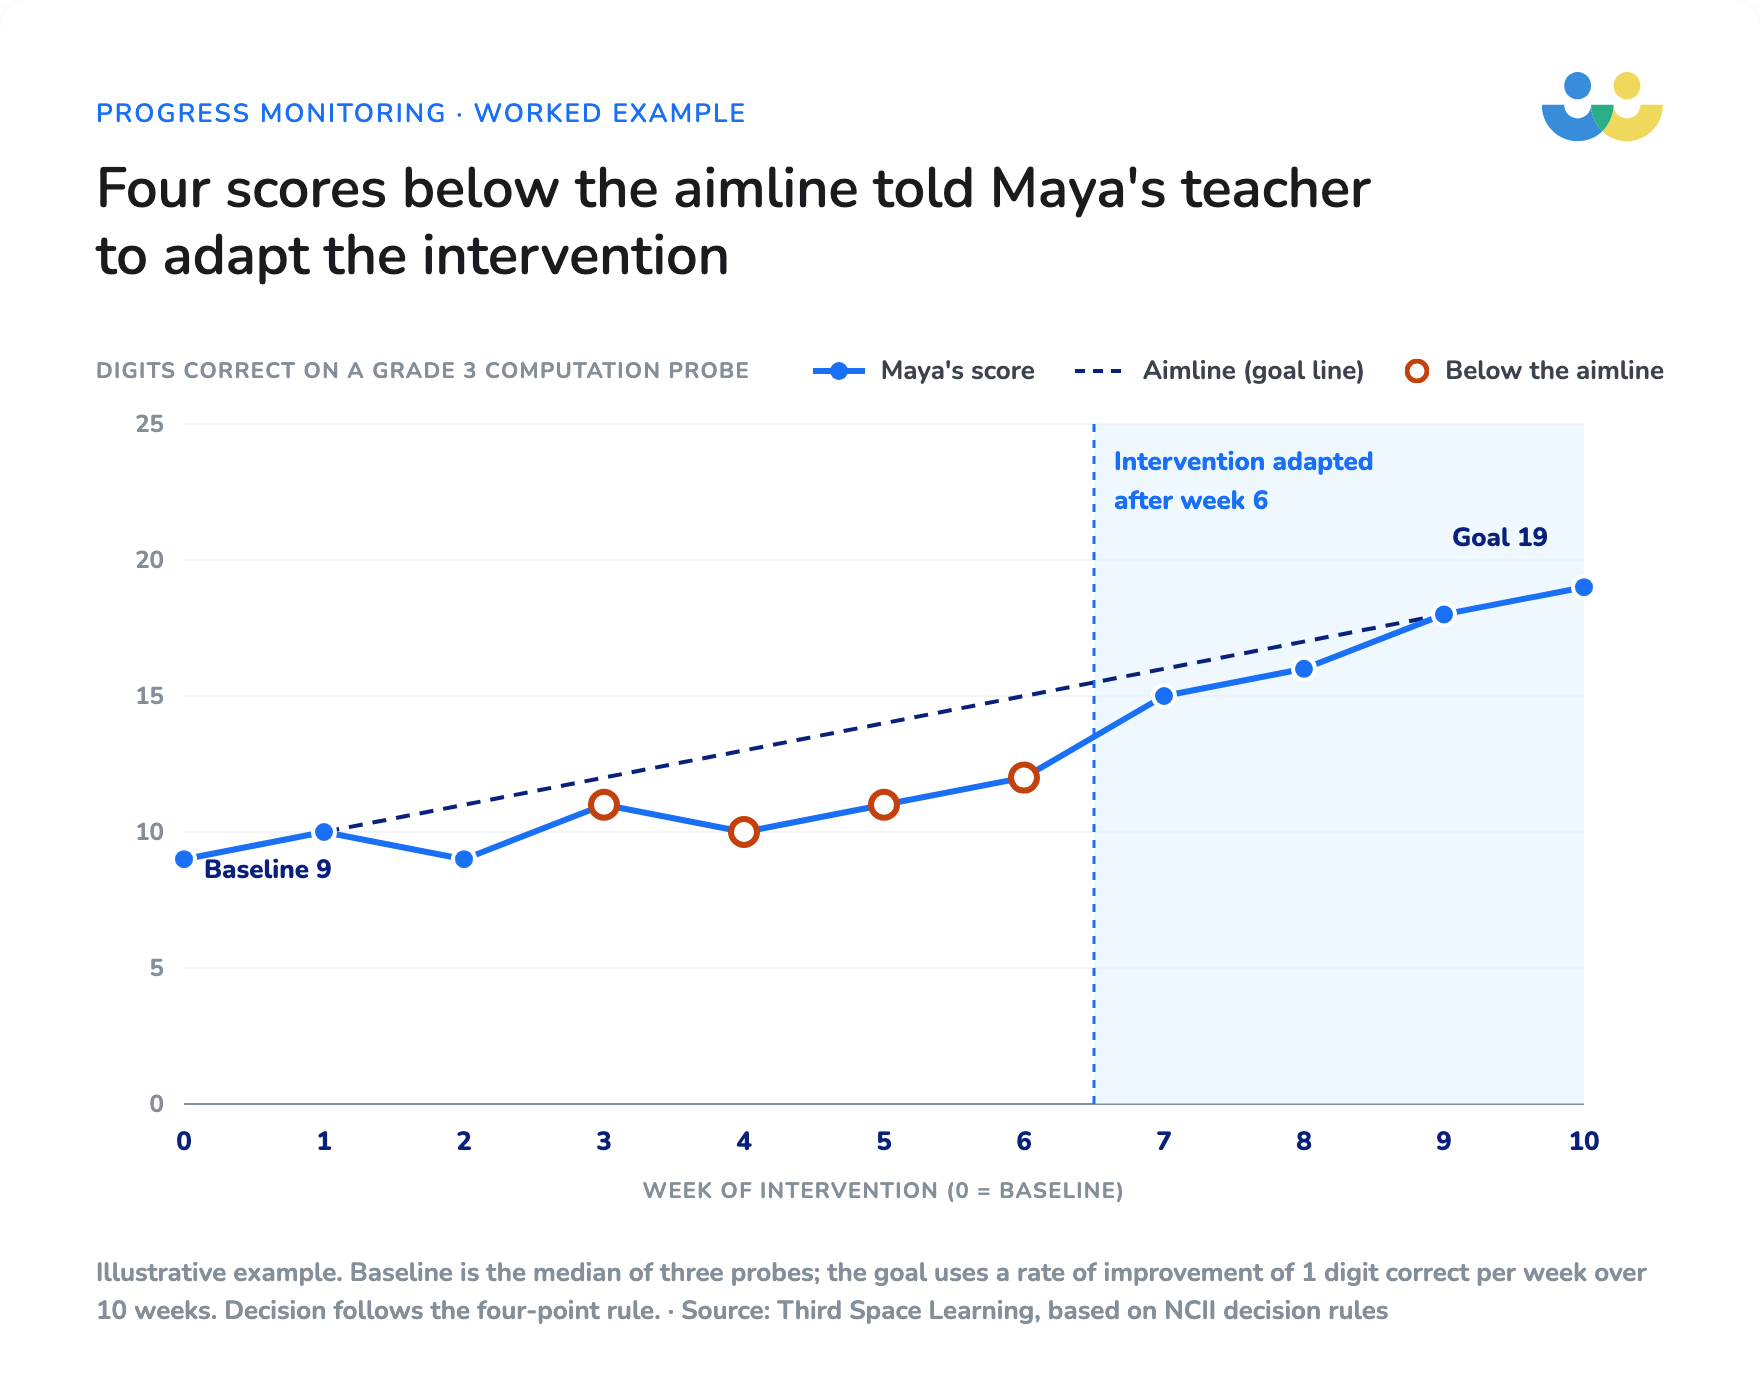
The last four points now sit on or just below the aimline, so the rule says to keep going. Without the graph, Maya’s scores in weeks 3 to 6 could easily have looked like slow but steady progress.
Progress monitoring tools for math
There are two broad approaches to progress monitoring, and most progress monitoring systems use one or both.
Curriculum-based measurement
Curriculum-based measurement (CBM) uses short, standardized probes that sample the skills a student should master across the whole year. Because every probe covers the same range of grade level content, CBM scores can be compared from fall to spring and show student growth over time. CBM probes take only a few minutes, and many allow group administration, so you can give them to a whole intervention group at once.
Mastery measurement
Mastery measurement tracks one skill at a time, such as adding fractions with like denominators, while the skill is still developing, and moves on once the student has mastered it. It’s useful for planning the next lesson, but because the skill changes, you can’t plot the scores on one long-term graph. You can use mastery measurement inside an intervention and CBM to judge whether the intervention is working overall.
Choosing a tool
NCII’s Academic Progress Monitoring Tools Chart rates tools on their technical adequacy, and it’s the best place to start when you select progress monitoring tools as a team. Like NCII’s goal-setting resources, it’s free to use. Key features to compare are the grades covered, the skills measured, the time each probe takes and the number of equivalent forms.
| Tool | Grades (math) | What it measures | Time per probe | On NCII chart? |
|---|---|---|---|---|
| aimswebPlus Math | K–8 | Number naming, math facts, mental computation, number sense fluency | 1–7 minutes | Yes |
| Acadience Math | K–6 | Computation; concepts and applications | 3–6 minutes | Yes |
| easyCBM | K–8 | Grade level math proficiency | About 20 minutes | Yes |
| FastBridge | K–5 (earlyMath, CBMmath Automaticity) | Early numeracy; math fact automaticity | 2–7 minutes | Yes |
| i-Ready Growth Monitoring | K–8 | General math growth (computer-adaptive) | About 15 minutes | Yes |
| Star Math | K–12 | General math achievement (computer-adaptive) | About 20 minutes | Yes |
| mCLASS Math | K–8 | Early numeracy and grade level skills | 10–15 minutes (small group) | No |
Your district may already have one of these. If it doesn’t, you can make your own probes from your curriculum, as long as each form tests the same skills at the same difficulty and you give it the same way every time.
Progress monitoring examples
These scenarios show how progress monitoring might look for different students. Each one pairs a skill with a measure and a frequency.
Math fact fluency (grade 2)
A small group working on addition facts to 20 takes a one-minute fact probe at the start of each session, twice a week. The teacher graphs the number of correct facts for each student.
Multi-digit computation (grade 3)
A Tier 2 student takes a weekly computation probe of mixed addition and subtraction, scored as digits correct, as in Maya’s case above.
Concepts and applications (grade 5)
A student whose screening scores showed gaps in fractions takes a concepts and applications probe every other week, with problems on equivalent fractions, comparing fractions and simple fraction word problems.
An IEP goal (grade 4)
A student’s IEP goal reads: “By the end of the IEP period, given a grade 4 math computation probe, Jordan will score 30 digits correct in two minutes on three consecutive probes.” The special education teacher gives the probe weekly and shares the graph with the family in each quarterly progress report.
A Tier 3 student (grade 6)
A student receiving one-on-one support on ratios takes a weekly probe, and the intervention team reviews the graph every three weeks using the four-point rule.
Progress monitoring in special education
Special education relies heavily on progress monitoring data. In many states, a student’s response to Tier 2 and Tier 3 intervention is part of the evidence used to decide whether they’re eligible for special education under a specific learning disability.
Measuring IEP goals
Under the Individuals with Disabilities Education Act (IDEA), every IEP must state how the child’s progress toward meeting the annual goals will be measured, and when periodic reports on that progress will be provided, such as quarterly reports issued alongside report cards. A curriculum based measure with a clear aimline makes those reports far easier to write, and it gives families a graph of student progress they can follow.
If a student’s data shows they aren’t on track, the IEP team can meet to adjust the instruction or the goal without waiting for the annual review.
What progress monitoring data from an AI math tutor looks like
Some interventions now generate their own data as students work. Third Space Learning’s AI math tutor, Skye, shows the kind of session-level data an intervention can give you.
Each one-on-one math tutoring session starts with a Skill Check In, a diagnostic question that decides whether the student works through the teaching steps or moves straight on to independent practice. When a student answers incorrectly, Skye gives a hint based on the type of misconception, and if they answer incorrectly a third time it models the correct steps. Every lesson is written or edited, and approved, by qualified math teachers.
The session ends with a Skill Check Out. Skill Check Out results are visible to teachers immediately after the session and contribute to cumulative progress reports. Session logs also show the concepts each student covered, allowing teachers to follow up in class the same week.

Teachers can also see real-time overview reports for whole cohorts, with the objectives each student has completed and the sessions they’ve attended.

This student data works like mastery measurement: it shows which skills a student secured in each session, which helps you plan what to reteach in class. It doesn’t replace a general outcome measure, so keep giving your CBM probe each week and make decisions from that one consistent graph.
Tips for implementing progress monitoring
If your school is implementing progress monitoring for the first time, these habits make the process easier to keep up.
- If you give the probe in the same way each time, with the same timing and instructions, changes in scores reflect learning.
- Build the probe into the intervention session itself, so it still happens in a busy week.
- When the team uses the decision rules in meetings, everyone reads the graphs the same way.
- Share the graph with the student and talk about what’s helping.
Making progress monitoring a school-wide practice
Effective progress monitoring needs support from school leaders, too. Leaders can support implementation by protecting time and resources for intervention teams to meet and using one progress monitoring system across grade levels, with staff trained to give and score probes consistently. When leaders and educators review student performance data together, fewer students are missed, and the ones who need timely interventions get them sooner. It helps to look at student engagement alongside the scores, because a flat line sometimes has more to do with attendance than with the intervention itself.
Do you have students who need extra support in math?
Skye – our AI math tutor built by experienced teachers – provides students with personalized one-on-one, spoken instruction that helps them master concepts, close skill gaps, and gain confidence.
Since 2013, we’ve delivered 2,295,000 math tutoring sessions to 196,000 students, guiding them toward higher math achievement.
Discover how our AI math tutoring can boost student success, or see how our math programs can support your school’s goals:
– 3rd grade tutoring
– 4th grade tutoring
– 5th grade tutoring
– 6th grade tutoring
– 7th grade tutoring
– 8th grade tutoring
Progress monitoring FAQs
Progress monitoring means giving a student a short, consistent assessment at regular intervals and graphing the scores, then using the trend to judge whether instruction or an intervention is working.
NCII recommends at least monthly for students in Tier 2 and at least weekly for students in Tier 3. If you monitor Tier 2 every week or two, you’ll have enough data points to make a reliable decision sooner.
In math, common probes include a weekly computation probe scored as digits correct, a one-minute math fact probe, a concepts and applications probe on fractions, and weekly checks on an IEP goal.
A good tool measures the skill the student is working on and takes only a few minutes. It should also have several equivalent forms and evidence of reliability and validity. NCII’s tools chart lets you compare options.
Yes. i-Ready Growth Monitoring takes about 15 minutes, but Curriculum Associates says to give it at most once a month, so weekly monitoring at Tier 3 needs a shorter probe alongside it.
Yes, for reading. DIBELS 8 has progress monitoring forms for kindergarten to grade 8, but it measures literacy only, so math needs a separate measure such as Acadience Math or aimswebPlus.
Curriculum based measurement is the most common kind of progress monitoring, but mastery measurement and computer-adaptive tests are also used.
In MTSS, progress monitoring shows whether students in Tier 2 or Tier 3 are responding to their support, so teams can decide whether a student stays in a tier, moves up or down, or is referred to be evaluated for special education.
On a graph, steady progress looks like scores rising roughly in line with the aimline, with some ups and downs, because students have good days and bad days. If four scores in a row fall below the aimline, that’s the signal to adapt the intervention.
It gives teachers regular evidence of how students are responding to instruction, so they can make timely decisions about reteaching and intervention during the year, when those decisions can still make a difference to student success. If you keep it going through the year, it gives you a steady way to support students’ academic success.


