FREE DOWNLOAD
Bar Chart Worksheets
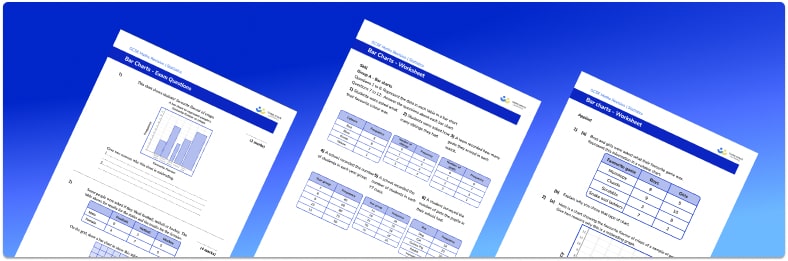
Help your students prepare for their Maths GCSE with this free bar chart worksheet of 43 questions and answers
- Section 1 of the bar chart worksheet contains 36 skills-based bar chart questions, in 3 groups to support differentiation
- Section 2 contains 4 applied bar chart questions with a mix of word problems and deeper problem solving questions
- Section 3 contains 3 foundation and higher level GCSE exam style bar chart questions
- Answers and a mark scheme for all bar chart questions are provided
- Questions follow variation theory with plenty of opportunities for students to work independently at their own level
- All questions created by fully qualified expert secondary maths teachers
Suitable for GCSE maths revision for AQA, OCR and Edexcel exam boards
Unlock access to download your free resource
You can unsubscribe at any time (each email we send will contain an easy way to unsubscribe). To find out more about how we use your data, see our privacy policy.
Raise maths attainment across your school with hundreds of flexible and easy to use GCSE maths worksheets and lessons designed by teachers for teachers.
Bar chart at a glance
A bar chart or bar graph is a frequency diagram that displays data using bars, with the height of each bar representing the frequency of that category. Along with pictograms (pictographs) and pie charts (pie graphs), they are primarily used to display categorical data.
When drawing bar charts, the x axis displays the data categories, and the y axis displays frequency. For a bar chart displaying categorical or non-continuous data, a gap is left between each bar. Bars are typically plotted vertically, but can appear horizontally. Double bar graphs can be used to compare two sets of related data.
An associated important skill in data handling is reading bar charts. Students are often asked to interpret the bar charts they have drawn, or to analyse a pre-drawn bar chart – for example, finding the mode by identifying the tallest bar.
Looking forward, students can then progress to additional Statistics worksheets, for example a mean, median, mode and range worksheet or frequency table worksheet.
For more teaching and learning support on Statistics our GCSE maths lessons provide step by step support for all GCSE maths concepts.

Do you have students who need additional support to achieve their target GCSE maths grade?
There will be students in your class who require individual attention to help them succeed in their maths GCSEs. In a class of 30, it’s not always easy to provide.
Help your students feel confident with exam-style questions and the strategies they’ll need to answer them correctly with personalised online one to one tutoring from Third Space Learning
Lessons are selected to provide support where each student needs it most, and specially-trained GCSE maths tutors adapt the pitch and pace of each lesson. This ensures a personalised revision programme that raises grades and boosts confidence.